Comprehensive Brent Oil for October 27, 2023
In this comprehensive analysis, Ultima Markets brings you an insightful breakdown of the Brent Oil (UKOUSD) for 27th October 2023.
Key Takeaways
- The Israeli-Palestinian conflict affects oil prices: Israel agreed to postpone its ground attack on Gaza this week, and crude oil price experienced a huge short-term correction, suggesting that risk sentiment is a key factor supporting current oil prices. If the conflict intensifies, oil prices will continue to rise.
- Geopolitical risks remain: The U.S. Department of Defense said that U.S. President Joe Biden had ordered strikes against Iran’s Islamic Revolutionary Guard Corps and two facilities used by Iran-backed groups in Syria. Oil prices rebounded in the short term.
Brent Oil Technical Analysis
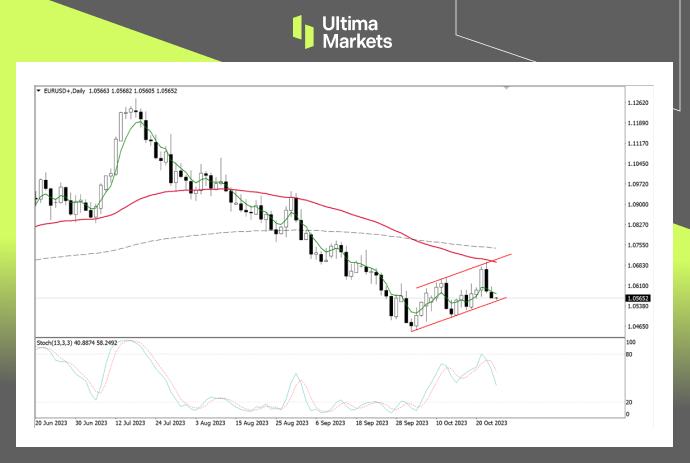
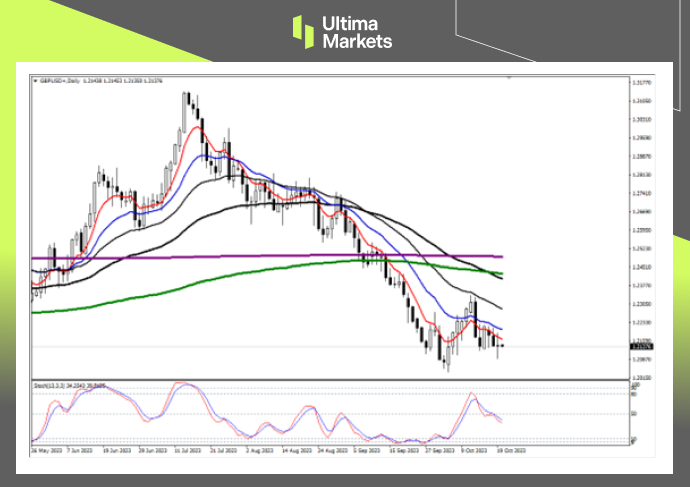
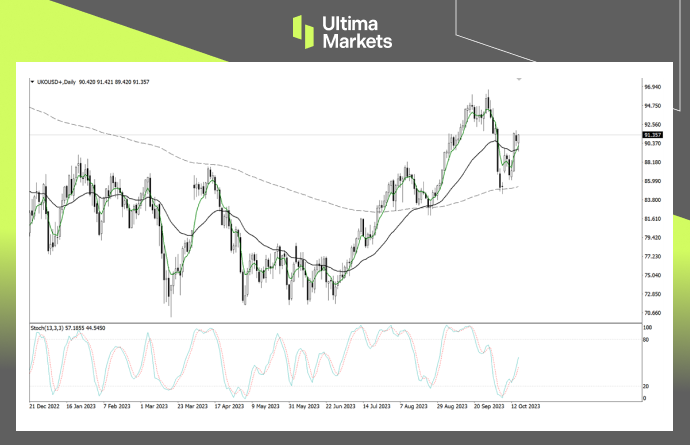
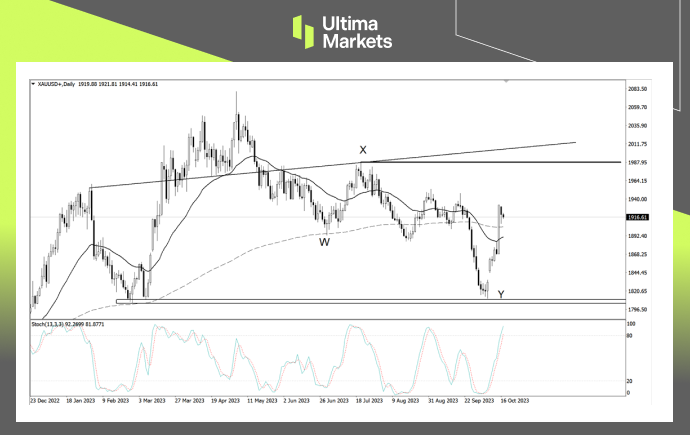
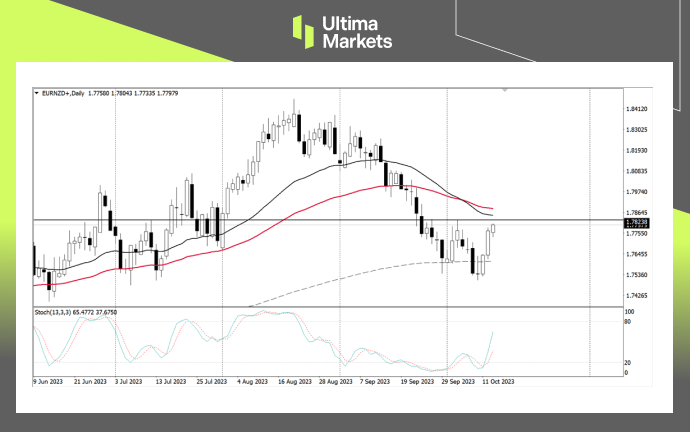
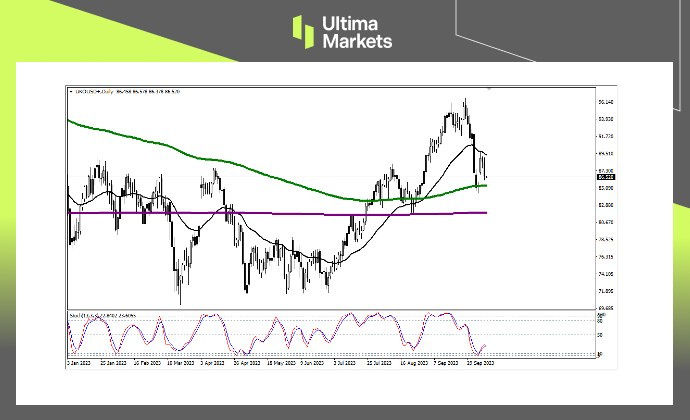
Brent Oil Daily Chart Insights
- Stochastic Oscillator: The fast line crosses the slow line, and the indicator falls to the 50 mid-line, suggesting that the market price will do a correction next.
- Price Action: Oil prices showed a bearish engulfing Pattern, suggesting that the market may decline further.
- Moving average group: The blue 17-day moving average and the black 65-day moving average form a consolidation range. The oil price has been moved in this price range for three consecutive days. Whether it can be bearish or bullish depends on the market price direction.
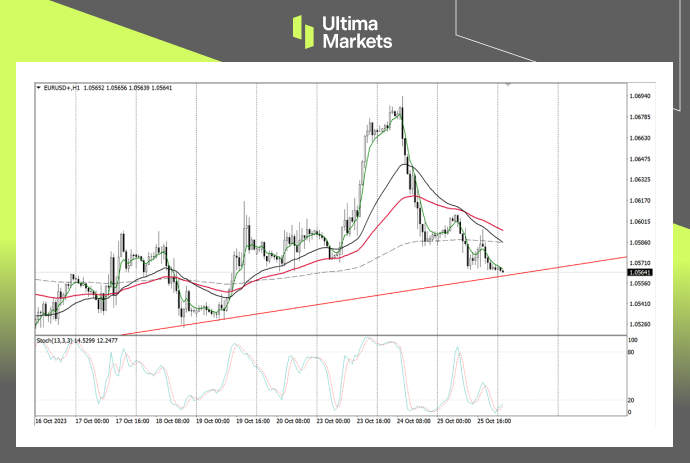
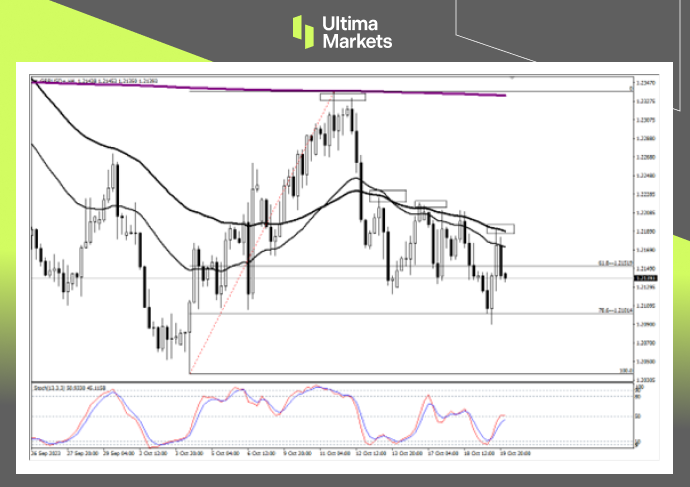
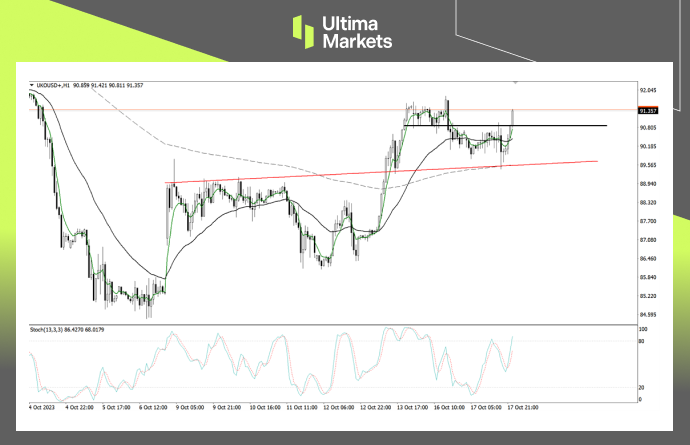
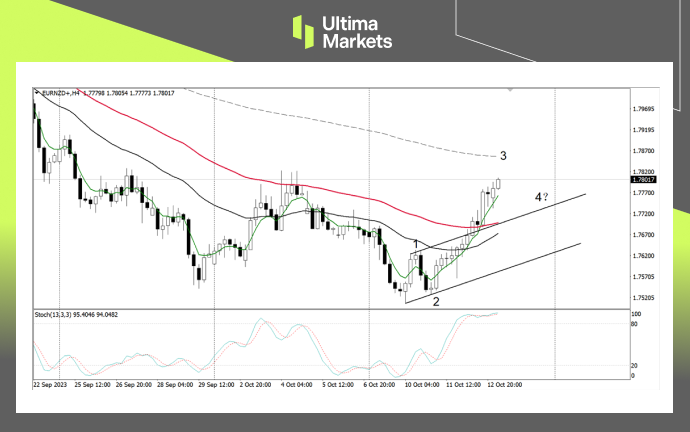
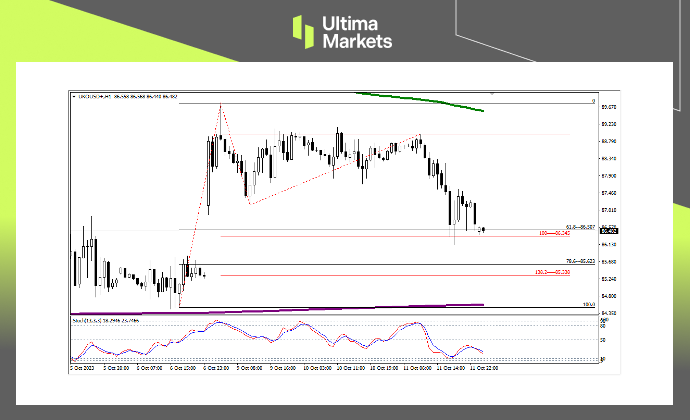
Brent Oil 1-Hour Chart Analysis
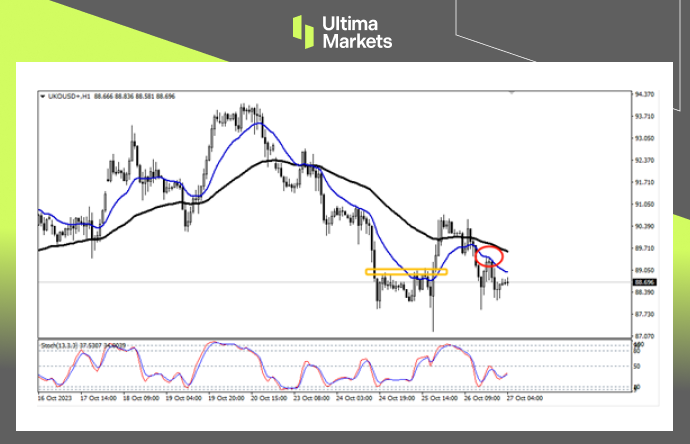
- Price Action: The direction of oil price is unclear. After oil prices rose above the yellow suppression price, the previous downward trend was destroyed, and the overall trend either reversed upward or experienced a longer-term shock adjustment.
- 17-period moving average: The market price fell below the moving average again. Yesterday, there was even a retracement of the 17-period moving average (red position), which implies that if the market falls below 87.876, the price will fall again. Otherwise, if it breaks through the red rebound area, the oil price will go upwards.
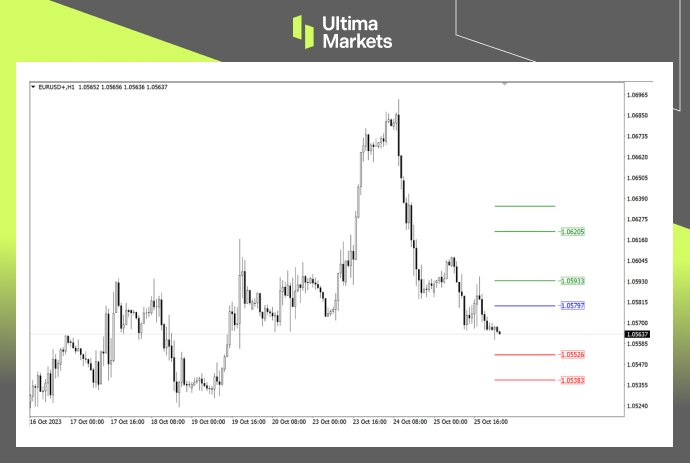
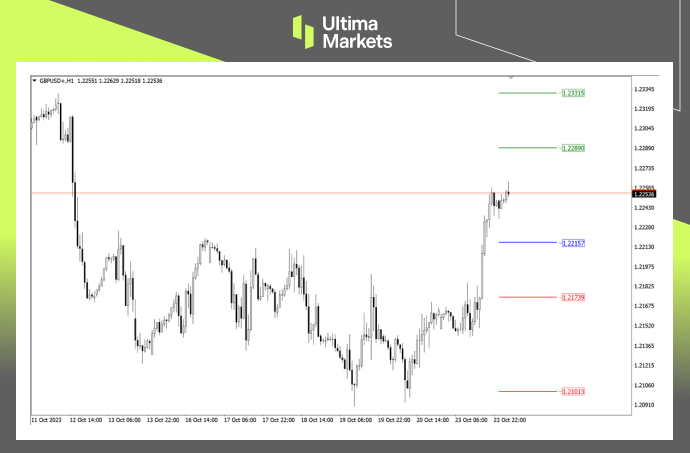
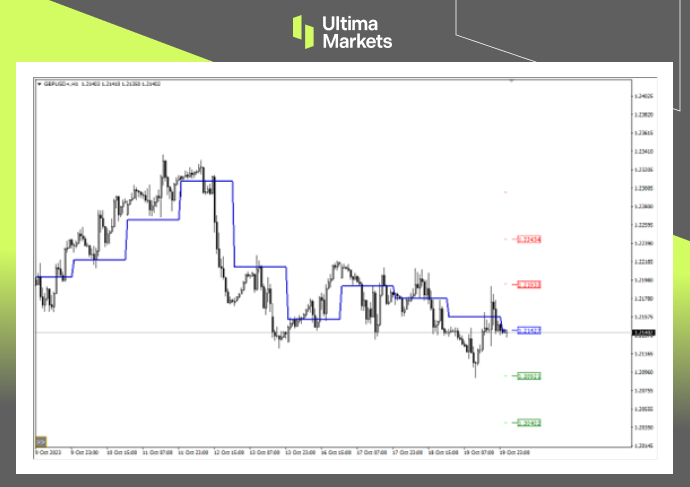
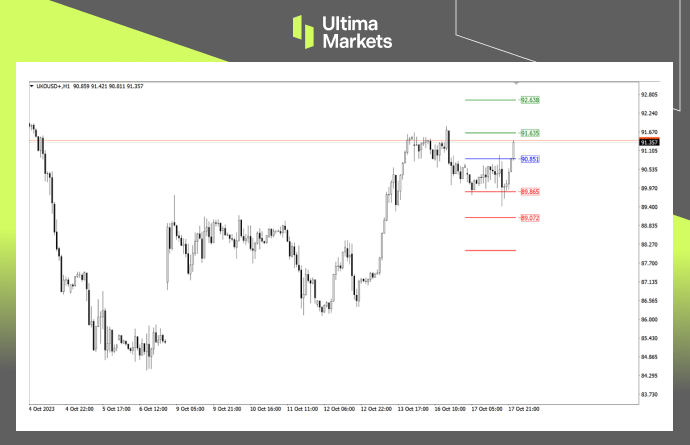
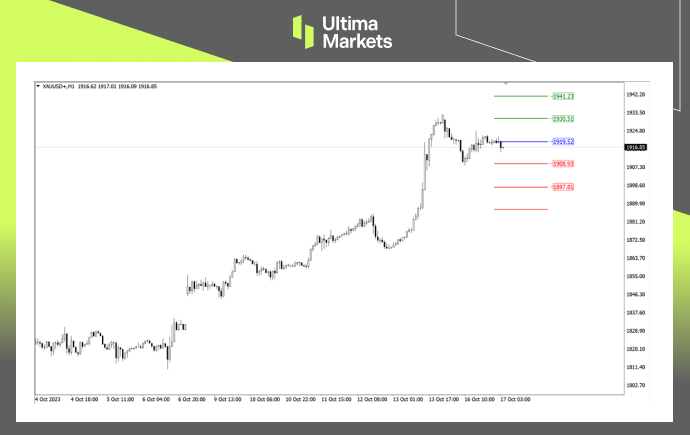
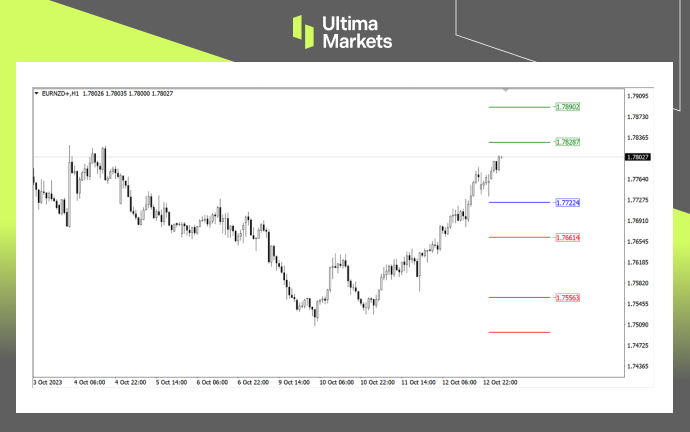
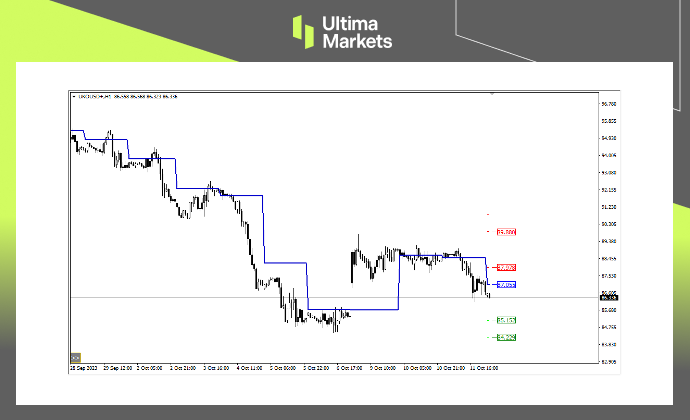
Ultima Markets MT4 Pivot Indicator
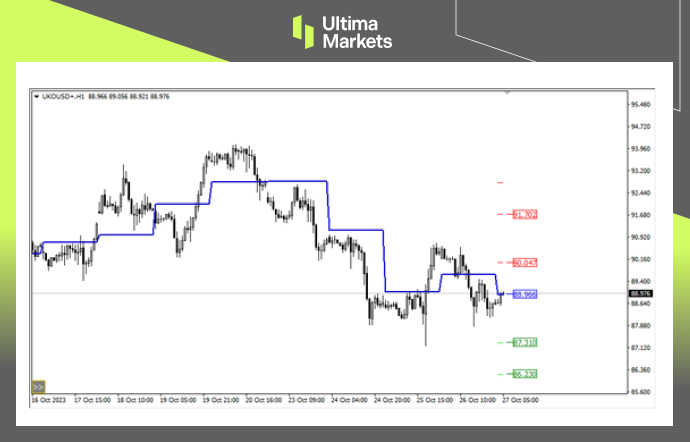
- According to the pivot indicator in Ultima Markets MT4, the central price of the day is established at 88.966,
- Bullish Scenario: Bullish sentiment prevails above 88.966, first target is 90.047, second target is 91.702.
- Bearish Outlook: In a bearish scenario below 88.966, first target 87.310, second target 86.230.