Yen’s Surge and Market Dynamics in October 2023


Japan’s Retail and Industrial Production Data Mixed, Yen Appreciated on Expectations of Monetary Policy Change

In the ever-evolving sphere of global economics, Japan’s financial landscape remains a focal point of interest. As we navigate through the intricacies of Japan’s retail and industrial sectors, we are presented with mixed data that fuels discussions and influences global market dynamics.

In this comprehensive analysis, we explore the recent surge of the Japanese Yen, the resilience of the retail industry, and the complexities of industrial production in Japan.


Japanese Yen Rose on YCC Anticipation

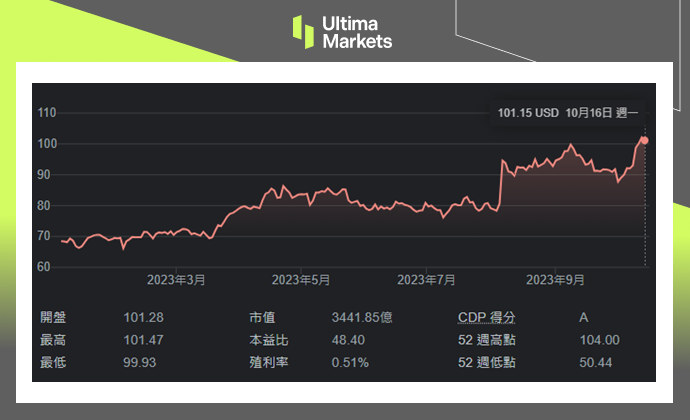
The Japanese yen appreciated against the U.S. dollar, reaching its highest level in nearly 3 weeks. The uplift was brought by the Japanese media reporting that the BOJ may change the monetary policies on Tuesday. 


Understanding the BOJ’s Yield Curve Control

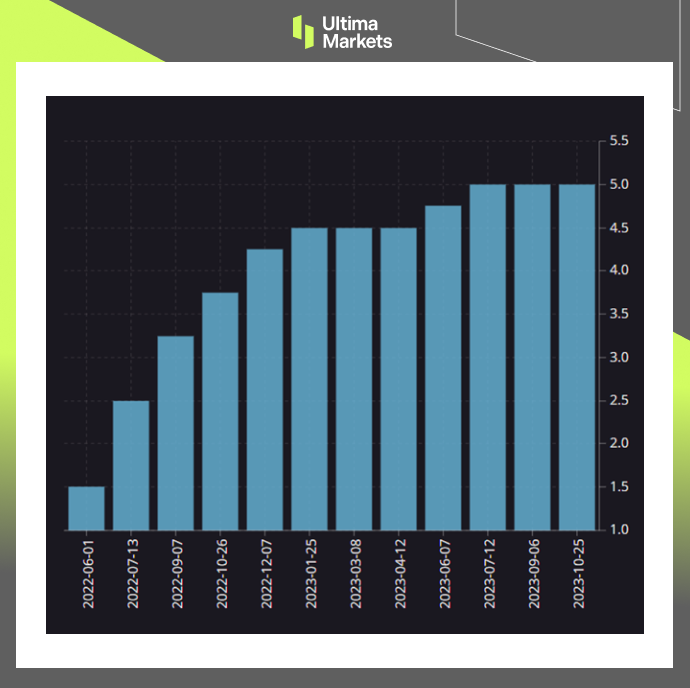
The BOJ adapts the yield curve control in an attempt to influence interest rates. The report said the central bank may allow long-term interest rates in Japan to rise. Specifically, it might let interest rates on 10-year government bonds go above 1%.

Last time, BOJ tweaked its yield curve control in July from 0.5% to 1%. Higher interest rates tend to make a currency more valuable to investors. As a result, the possibility of Japan raising rates helped make the yen stronger compared to the dollar. 

USD/JPY One-year Chart

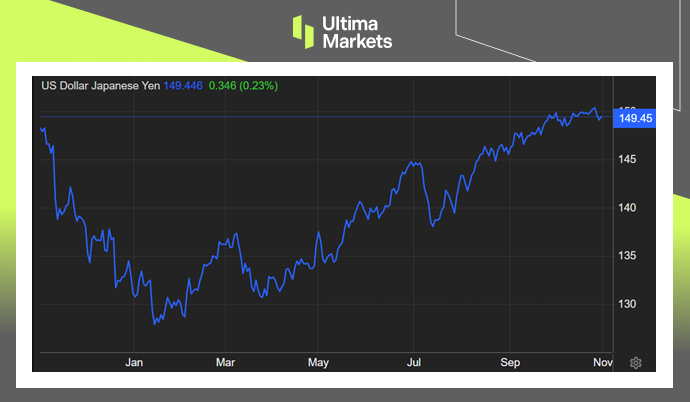
(USD/JPY One-year Chart) 


Japanese Retail Sales Recovering from Pandemic 

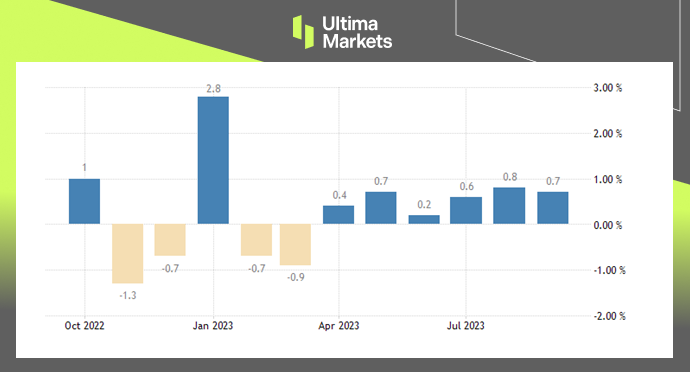
Retail sales in Japan rose 5.8%YoY in September. This is a slower increase than the 7% jump in sales seen in both July and August. The September gain was about in line with forecasts expecting a 5.9% rise. Still, it marked the 19th month in a row that retail sales have grown in Japan. This shows consumer spending continues to recover after dropping during the pandemic.  

Japan Retail Sales, METI Japan

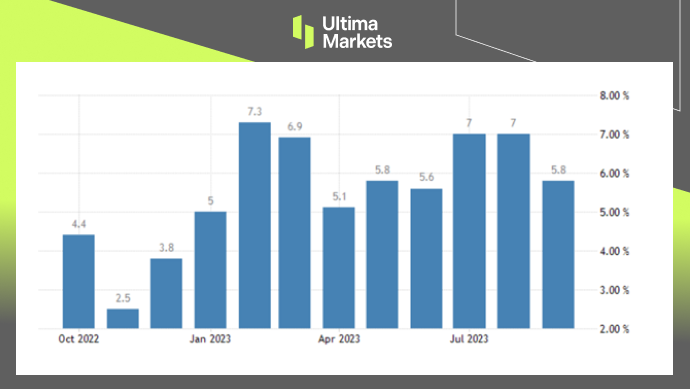
(Japan Retail Sales, METI Japan) 


Insights into Consumer Spending Recovery

This continuous growth in retail sales reflects Japan’s steadfast commitment to economic recovery, particularly in the face of the challenges posed by the global pandemic.

It underscores the unwavering nature of consumer spending, even after a significant drop during the early stages of the pandemic.

The retail sector’s ability to adapt and thrive in challenging circumstances showcases Japan’s economic resilience.


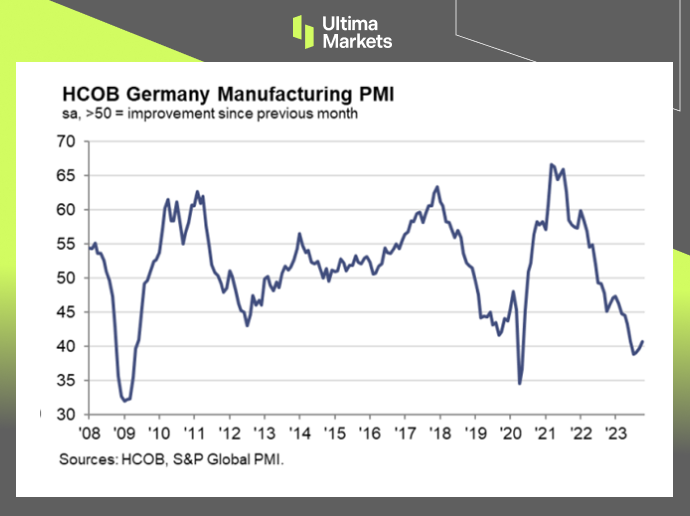
Japan’s Industrial Production Fell Short of Expectations

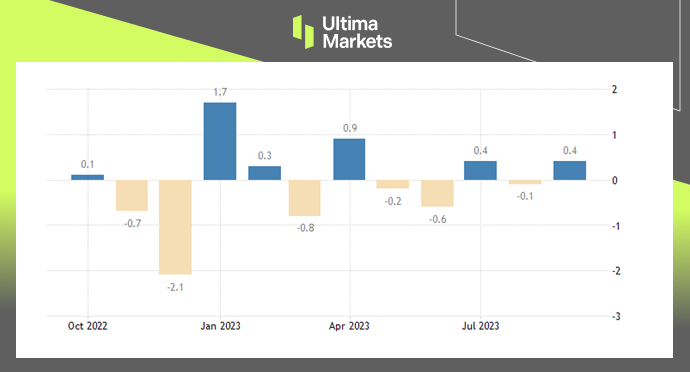
In September, Japan’s industrial production experienced a modest growth of 0.2% compared to the previous month. However, this figure fell short of market expectations, which had predicted a 2.5% increase.

The September result represents a turnaround from the 0.7% decline that was recorded in the previous month. Importantly, this marks the first positive change in industrial output since June.


Factors Influencing Industrial Output

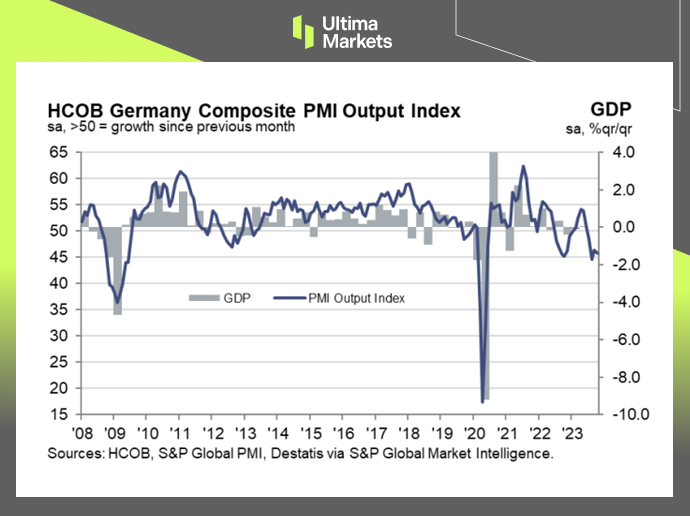
The increase in production was primarily driven by notable improvements in the manufacturing of motor vehicles, which saw a substantial increase of 6.0% compared to a decline of 3.9% in August.

Additionally, there was growth in the production of general-purpose and business-oriented machinery, which showed a 2.6% increase compared to a 1.0% decrease in the preceding month.

However, when considering the annual comparison, industrial output in September exhibited a decline of 4.6%. This follows a 4.4% drop in August and signifies the third consecutive month of contraction in industrial production. 

Japan Industrial Production, METI Japan

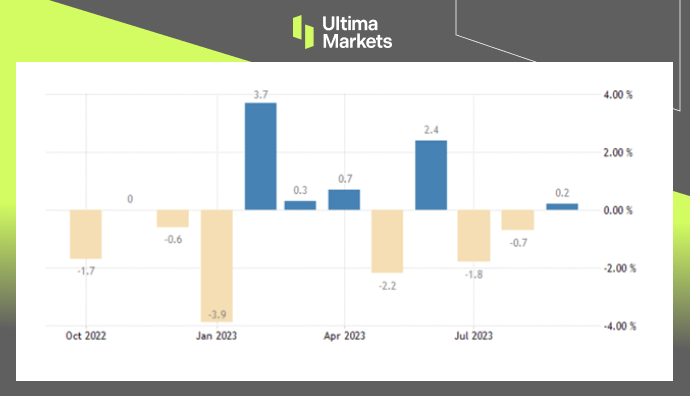
(Japan Industrial Production, METI Japan) 


Conclusion

In conclusion, this comprehensive analysis deciphers Japan’s economic landscape, characterized by the Japanese Yen’s notable surge, the resilience of the retail sector, and the complexities surrounding industrial production.

These facets collectively shape Japan’s economic future, emphasizing the crucial role of policy adjustments and market dynamics in determining the nation’s economic well-being. Stay tuned for further insights into the ever-evolving economic terrain of Japan.


Strategic Hedging Fuels Surge in Precious Metals Trading


Gold Surges Past $2,000 Driven by Geopolitical Tensions

Israeli forces have begun their largest ground attack in Gaza so far in the war with Hamas, despite ongoing diplomatic efforts to delay an expected full ground invasion.

Fueled by hedge buying, Gold raised above $2,000 an ounce and marked the third straight weekly gain.

Gold is trading within a very steep ascending channel, which highlights not only the strength of the current rally but also the need for consolidation. 

Gold Price USD/Ounce

(Gold Price USD/Ounce) 


The Gold Rally: A Closer Look

The Middle East’s developing geopolitical events, particularly the ongoing conflict between Israeli forces and Hamas, are primarily responsible for the recent spike in gold prices.

Israeli forces have launched their most extensive ground attack in Gaza to date, despite continuous diplomatic efforts to avert a full-scale ground invasion.

This significant escalation of hostilities has triggered a sharp increase in the demand for gold, predominantly driven by a surge in hedge buying.


Geopolitical Tensions: The Catalyst

The heightened geopolitical tensions have underscored the importance of gold as a safe-haven asset. During times of uncertainty and conflict, investors and institutions alike turn to gold as a reliable store of value.

The surge in gold prices reflects not only the current rally’s strength but also the market’s demand for a stable and secure asset amidst turmoil.


A Steep Ascending Channel

Gold’s impressive ascent is further emphasized by its trading within a steep ascending channel. This upward price trend signifies not only the robustness of the current gold rally but also the necessity for consolidation.

The ascending channel illustrates the market’s optimism regarding gold’s potential and its sustained upward trajectory.


Silver Softened, After Hitting a High 

On the other hand, silver, a valuable metal often sought as a safe investment during uncertain times, received ongoing support due to the Middle East conflict.

Additionally, the prospects for increased industrial usage of silver were strengthened by additional stimulus measures implemented in China.

However, silver prices didn’t sustain strength, falling below $23.3 per ounce, following a recent peak on October 20th.  

Silver Price USD/Ounce

(Silver Price USD/Ounce) 


Conclusion

The surge in gold prices, driven by geopolitical tensions in the Middle East, marks a pivotal moment in the precious metals market.

Gold’s status as a safe-haven asset has been reaffirmed, and its upward trajectory within a steep ascending channel suggests a continued bullish sentiment.

While silver also responded positively to global turmoil, its recent price decline highlights the complex dynamics within the precious metals market.

Stay tuned for more updates as we navigate these exciting developments in the world of precious metals.


US GDP and Durable Goods Came in With Terrific Results


U.S. GDP Up 4.9% in 3Q, Fastest Growth in Past Two Years 

The U.S. Department of Commerce reported that U.S. GDP grew by 4.9% in the third quarter, exceeding the 2.1% growth in the second quarter and economists’ expectations. Strong consumer spending contributed to the growth drive.  


Consumer Spending Takes Center Stage

Consumer spending experienced a significant increase of 4%, marking the highest growth rate since the fourth quarter of 2021. The uptick surpassed the modest 0.8% increase seen in the second quarter of 2023.  

U.S. GDP,U.S. Department of Commerce

(U.S. GDP,U.S. Department of Commerce)


U.S. Durable Goods Orders lifted 4.7% MoM in September, Exceeding Expectations 

After contracting by 0.1% in August, new orders for manufactured durable goods in the US increased by 4.7% month over month in September 2023, well above the 1.7% increase that the market had anticipated.  


Transportation Equipment Leads the Charge

The standout feature in the durable goods orders report is the resurgence of demand for transportation equipment. Orders for transportation equipment witnessed a remarkable increase of 12.7% in September, a stark contrast to the 1.1% decrease observed in August. This upswing is largely attributed to the heightened demand for civilian aircraft.

U.S. Durable Goods Orders, U.S. Census Bureau

(U.S. Durable Goods Orders, U.S. Census Bureau)


Conclusion

In summary, the most recent U.S. GDP and Durable Goods reports for the third quarter of 2023 have portrayed a bright and hopeful image of the nation’s economic well-being. Powered by vigorous consumer spending propelling GDP growth and an enduring demand for durable goods, the future appears promising.

These impressive outcomes underscore that the U.S. economy is following a robust trajectory, laying the groundwork for potential prosperity in the upcoming months.

As we persist in vigilantly tracking economic developments, it becomes imperative to remain well-informed and adaptable in the face of this ever-evolving landscape.

This approach equips us to make sound, well-considered choices and seize opportunities within the dynamic economic environment we navigate.


Decipher Canada’s Inflation and the BOC’s Powerful Strategy


Understanding Canada’s Inflation Control and the BOC’s Monetary Policy

Within the intricate realm of economics, grasping the nuances of inflation control stands as a paramount endeavor. This article embarks on an exploration of Canada’s adept strategies for effectively managing inflation, while shedding light on the rationale behind the Bank of Canada’s (BOC) choice to uphold a 5% interest rate during its pivotal October 2023 meeting.


BOC Keeps Policy Rates Steady at 5%

In the world of economics, central banks like the BOC use interest rates as a critical tool to influence economic conditions.

During its October meeting, the BOC chose to maintain the overnight rate at 5%. This decision has far-reaching implications, and to understand them, we need to explore the BOC’s broader monetary strategy.

(Policy interest rate, Bank Of Canada) 

(Policy interest rate, BOC) 


The Path to Stability: BOC’s Quantitative Tightening Policies

Quantitative tightening policies are at the forefront of the BOC’s monetary strategy. These policies encompass a series of actions aimed at tightening the money supply and controlling inflation. They are pivotal in ensuring economic stability and facilitating future growth.


What Are Quantitative Tightening Policies?

Quantitative tightening policies involve reducing the money supply by selling government bonds or other assets. By doing so, the BOC can absorb excess liquidity in the market, which, in turn, puts upward pressure on interest rates.


Understanding Canada’s Inflation Control

A pivotal metric under the constant scrutiny of the BOC is the Consumer Price Index (CPI). The CPI serves as a barometer of inflation, capturing the evolving costs of a diversified basket of goods and services over time. In recent months, Canada’s CPI has demonstrated a degree of volatility, warranting close attention.


Canada Inflation Levels Getting Under Control 

  • In June, the CPI was at 2.8%.
  • August saw a sharp increase, with the CPI reaching 4.0%.
  • September reported a CPI of 3.8%.

Bank Of Canada’s Projections

The BOC’s latest projections provide valuable insights into the future of inflation in Canada:-

Short-Term Outlook

  • The BOC’s projections suggest that the CPI is poised to maintain an average of approximately 3.5% until the middle of the upcoming year.
  • Short-term inflation trends are primarily steered by the influence of energy prices and the enduring presence of core inflation factors.

Long-Term Goals

  • Post-mid next year, the BOC projects a gradual decrease in inflation.
  • The ultimate goal is to reach a 2% inflation rate by 2025, signifying a more stable economic environment.

Conclusion

Canada’s economic panorama is intricately intertwined with the monetary policy choices of the BOC and its strategies for inflation management.

Vigilantly monitoring these evolutions empowers individuals and enterprises to make judicious financial decisions, adeptly traverse the economic terrain, and play a role in upholding the nation’s economic equilibrium.

Grasping the BOC’s position on interest rates and inflation control is of paramount importance for anyone with a stake in the Canadian economy, ensuring they remain well-informed and well-prepared for the challenges and opportunities that lie on the horizon.


Germany’s Manufacturing Rebounds: A Comprehensive Analysis


Better-than-expected Manufacturing PMI Recorded for Germany

In October 2023, Germany’s manufacturing sector delivered a surprising uptick in performance, marked by the HCOB Flash Germany Manufacturing PMI reaching a 5-month high of 40.7.

This exceeded both expectations and the previous month’s record of 39.6, suggesting a promising turn of events in the German industrial landscape.

While this positive development is noteworthy, it’s essential to understand the broader context of the economic environment and the challenges faced by businesses and labor conditions.


A Ray of Hope in Germany’s Manufacturing

The HCOB Flash Germany’s Manufacturing PMI remarkable rise to 40.7 in October 2023 is a cause for optimism. It’s a significant leap, surpassing the September record and defying expectations. This surge, however, comes with nuances worth exploring.

While the Germany’s manufacturing sector showcased resilience, new orders suffered substantial losses. The decline is evident, reaching its lowest level since June. Additionally, the rate at which companies downsized their workforce in October was the fastest since October 2020.

The pricing front painted a mixed picture: factory gate charges continued their fifth consecutive month of decline, albeit at a slower rate, while manufacturers faced considerable drops in the costs of purchasing materials. Importantly, manufacturers retained a sense of pessimism regarding the future.

These statistics suggest that while manufacturing improved, challenges still persist. The manufacturing sector’s resilience in the face of adversity is a testament to its robust nature, but the decline in new orders and the workforce reduction rate warrant close monitoring.

(HCOB Flash Germany's Manufacturing PMI,S&P Global) 

(HCOB Flash Germany Manufacturing PMI,S&P Global) 


German Composite PMI Displaying Lukewarm Business Activities  

In October 2023, the HCOB Germany’s Composite PMI painted a different picture, falling to 45.8, below the previous month’s 46.4 and market expectations of 46.7. This decline points to an overall contraction in economic activity.

Both the service sector, which showed slight improvement the previous month, and Germany’s manufacturing output continued to decrease. Furthermore, the inflow of new business saw its sharpest decline since May 2020, and backlogs of work dwindled.

One significant concern is the rise in unemployment, compared to September, when workforce numbers had declined for the first time in nearly 3 years. On the pricing front, the rate of inflation for output charges remained relatively stable in October, following a low point in September. Regrettably, businesses maintained a low level of confidence in the outlook for the year ahead.

These trends in the Composite PMI are cause for concern. The decline in overall economic activity, the contraction of the service sector, and persistent unemployment challenges paint a less optimistic picture. It’s imperative to closely monitor these trends to gauge the trajectory of Germany’s economy.

(HCOB Flash Germany Composite PMI Output Index,S&P Global) 

(HCOB Flash Germany Composite PMI Output Index, S&P Global) 


Conclusion

In conclusion, Germany’s manufacturing sector’s unexpected rebound in October 2023 is a welcome development, demonstrating its resilience in the face of adversity.

However, the decline in new orders, the rapid workforce reduction rate, and ongoing pessimism regarding the future highlight the challenges that persist.

Meanwhile, the Composite PMI figures indicate a broader economic slowdown, with the service sector contracting, unemployment rising, and businesses maintaining a cautious outlook.

As businesses and policymakers navigate these uncertain times, understanding the intricate dynamics of Germany’s economic landscape becomes increasingly crucial. While there are bright spots, acknowledging the challenges and seeking solutions is essential to ensuring a stable and thriving economic future for the country.


Job Security Endures Amid Australia’s Sluggish Manufacturing


Reviving Australian Manufacturing: A Roadmap for Success

In recent times, Australia’s manufacturing sector has faced a challenging landscape. The Manufacturing PMI hit its lowest level in six months, declining to 48 in October 2023 from 48.7 in the previous month. This marks the eighth consecutive monthly decline in business conditions, a cause for concern.


Understanding the Decline

The Manufacturing PMI decline is primarily attributed to decreased production and diminished new order volumes in response to weakened demand. It’s a ripple effect that has been impacting the industry, causing concern among stakeholders.

Input expenses have witnessed a notable surge, driven by mounting inflationary pressures reaching a peak not seen in seven months. One of the principal contributors to these rising input expenses is escalating fuel costs. Although output charges also rose, the pace of increase was comparatively slower.

The current state of the market is making business sentiment worse than it has been in the past three and a half years. A ray of hope exists in the form of employment levels, which have continued to rise despite these obstacles.

Judo Bank Australia Manufacturing PMI,S&P Global

(Judo Bank Australia Manufacturing PMI,S&P Global) 


The Role of Composite PMI

The Composite PMI is equally important in understanding the economic landscape. In October 2023, it dropped to 47.3, plunging from 51.5 in the preceding month. This figure represents the lowest reading observed over a span of 21 months. This significant decline in operational performance across Australia’s private sector is a cause for concern.

The downturn in business activity is a result of several factors, including a reduction in incoming orders, an unfavorable demand climate, mounting inflationary pressures, and elevated interest rates. The volume of new export business experienced a decline for the eighth consecutive month.

Input costs continued their rapid advancement, stimulated by rising inflation that reached a three-month high. Output prices exhibited an increase as well, albeit weakened customer demand exerted pressure on pricing capabilities, resulting in the slowest pace of charge inflation since March 2021.

(The Judo Bank Flash Australia Composite PMI,S&P Global) 

(The Judo Bank Flash Australia Composite PMI,S&P Global) 


A Roadmap for Success

To revive the Australian manufacturing sector and ensure employment stays viable, a well-thought-out roadmap is necessary. Here are some key strategies that can be employed:

1. Innovation and Technology Adoption

The manufacturing sector should invest in research and development to enhance product quality and efficiency. Embracing advanced technologies like automation, robotics, and data analytics can significantly improve productivity.

2. Sustainable Practices

Implementing sustainable practices not only reduces the environmental impact but also attracts consumers who prioritize eco-friendly products. This can create new markets and opportunities for growth.

3. Skills Development

Investing in the workforce is crucial. Upskilling employees to meet the demands of a changing industry is essential. Government incentives and partnerships with educational institutions can facilitate this process.

4. Export Diversification

Reducing reliance on a single market by diversifying export destinations can safeguard against economic downturns in specific regions. Exploring emerging markets and trade agreements can open up new avenues.

5. Government Support

Collaboration with the government for policy changes and financial support is vital. Encouraging initiatives that stimulate growth, such as tax incentives for research and development, can be a game-changer.


Conclusion

To sum up, within the current landscape of Australia’s manufacturing sector, there lie not only challenges but also promising avenues for expansion and renaissance.

Through the wholehearted adoption of innovation, sustainability, skills enhancement, diversification in exports, and the backing of governmental initiatives, the sector can carve a trajectory towards triumph, safeguarding the viability of employment in the process.

Australia’s manufacturing industry has a bright future if it can adapt to the changing times and navigate the challenges effectively.


Oil Markets Surge Amidst Geopolitical Uncertainty

Geopolitical Turmoil Fuels Oil Price Surge

Amidst the volatile landscape of the global oil market, October 2023 stands out as a month of upheaval and uncertainty, with crude oil prices surging to a noteworthy $90 per barrel.

This escalation can be attributed to escalating geopolitical tensions, notably the intensifying conflicts between Israel and Gaza, which has far-reaching implications for the world’s energy sector.

Crude Prices Rushed to US$90 on Escalating Tensions in Middle East   

Escalating turmoil between Israel and Gaza ramped up concerns of supply disruptions among key producers in the Middle East. Additionally, U.S. military forces in Iraq were targeted in two separate drone attacks further intensifying market sentiment. Both WIT and Brent have emerged at the $90 per barrel mark, a significant technical threshold.  

Brent Crude One-year Chart By Ultima Markets MT4

(Brent Crude One-year Chart) 

WIT Crude One-year Chart By Ultima Markets MT4

(WIT Crude One-year Chart) 


Sharp Decrease in Global Oil Reserves 

According to the latest International Energy Agency (IEA) report, in August, there was a significant decline in global oil inventories, with a decrease of 63.9 million barrels (mb) observed.

This drop was primarily driven by a massive drawdown of 102.3 mb in crude oil stocks. Initial data indicates that inventories on land continued to decrease in September, but there was a rebound in oil stored on water as exports started to recover.


Inventory Trends

In the OECD countries, industry stocks experienced an unusual decline of 6.5 mb in August, reaching a total of 2,816 mb, which is substantially lower by 105.3 mb compared to the five-year average. 


Conclusion

In conclusion, the surge in crude oil prices to $90 per barrel in October 2023 can be primarily attributed to escalating geopolitical uncertainty, particularly in the Middle East.

The tensions between Israel and Gaza, coupled with drone attacks on U.S. military forces in Iraq, have heightened concerns about potential disruptions in the global oil supply chain.

As a result, the energy industry and financial markets are navigating a period of uncertainty, emphasizing the interconnectedness of geopolitics and global energy markets.

We will continue to watch these developments closely, as they have the potential to reshape the oil market landscape in the coming months.


RBA Contemplates Rate Hike Amidst Strong Job Data Surge

Australia Unemployment Rate Hit New Lows in the last three months

As of September, the nation boasts a strikingly low unemployment rate of 3.6%, surpassing market expectations and marking a significant improvement from August’s 3.7% figure.

The ripple effect of this achievement is evident as 19.8 thousand people found employment, reducing the total number of unemployed individuals to 520.5 thousand. The youth unemployment rate remains stable at 8.1%.


Peeling Back the Layers: A Deeper Dive

While the reduced unemployment rate is undoubtedly a noteworthy feat, a more granular analysis unveils a complex employment landscape:


Employment Statistics

  • Total employment increased by a modest 6.7 thousand, reaching 14.11 million, falling short of market expectations set at 20 thousand.
  • August saw a more substantial increase of 63.3 thousand, highlighting the employment market’s volatility.
  • Part-time employment surged, with 46.5 thousand individuals securing part-time positions, totaling 4.30 million. In contrast, full-time employment saw a decrease of 39.9 thousand, resulting in 9.81 million full-time workers.

Participation Rate and Underemployment

  • The participation rate, calculated as the number of job seekers relative to the total adult population, witnessed a slight decrease, falling from the all-time high of 67% to 66.7%. This hints at the nuanced dynamics of employment.
  • On the flip side, underemployment, reflecting the number of individuals seeking additional work, saw a modest drop from 6.5% to 6.4%. This suggests that those who are employed are aligning their work with their preferences and skill sets.
Unemployment Rate graph by Australian Bureau of Statistic

(Unemployment Rate, Australian Bureau of Statistics) 


RBA to hike rates likely again 

For last four months, the Reserve Bank of Australia (RBA) have not changed their interest rate. The RBA has been attempting to determine if those 12 rate increases were sufficient enough to control the inflation levels. 

According to the RBA, inflation will reach its 2–3% target by June 2025. On the other hand, RBA forecasts a slow upward turn in the unemployment rates to reach 4% by 2023 year-end. On Friday, November 10, the RBA will publish their latest forecasts. 


Conclusion

The employment data for September 2023 paints a compelling picture of Australia’s economic trajectory. The substantial drop in the unemployment rate, combined with the intricate details of employment types, has garnered the attention of diverse stakeholders.

As the RBA assesses the impact of its recent rate decisions on inflation, these employment statistics will undoubtedly steer future monetary policy.

In this dynamic economic landscape, staying informed and adaptable is paramount for making well-informed financial choices.

As the future unfolds, keep a vigilant eye on Australia’s employment scenario, a pivotal indicator of the nation’s economic health.


Sep’23 Economic Growth Soars for US Retail and Manufacturing


U.S. Retail Sales Thrived in September 2023

As we delve into the latest economic data for September 2023, it becomes evident that the U.S. retail and manufacturing sectors are experiencing notable developments.

This comprehensive report highlights the key statistics and trends that are shaping these critical segments of the American economy.


Consumer Spending Takes the Lead

In September, U.S. retail sales increased by a solid 0.7%, building on the previous month’s 0.8% rise. This is good news, especially given the challenges posed by high prices and borrowing costs. Consumers continued to show confidence by spending more than expected, defying economic uncertainties.


Leading Categories

Several categories saw remarkable growth:

  • Miscellaneous store retailers: Up by 3%
  • Non-store retailers: A solid increase of 1.1%
  • Motor vehicles and parts dealers: An impressive 1% growth
  • Gasoline stations: 0.9% increase

It’s important to note that these figures don’t account for inflation, making these results even more noteworthy.

Retail Sales Chart by Ultima Markets MT4

(Retail Sales, United States Department of Commerce) 


Diverse Sectors Register Growth

In addition to the standout categories, other sectors also did well:

  • Food services and drinking places: 0.9% rise
  • Health and personal care stores: An 0.8% increase
  • Food and beverage stores: 0.4% growth
  • General merchandise stores: Also up by 0.4%

However, some sectors experienced declines:

  • Electronics and appliances: Decreased by 0.8%
  • Clothing stores: A drop of 0.8%
  • Building material and garden equipment stores: A slight dip of 0.2%

Even when we exclude automobile sales, gasoline, building materials, and food services, retail sales still rose by a solid 0.6%. These results are a testament to consumer resilience in the face of economic challenges.


Strong U.S. Manufacturing Output Growth 

Manufacturing Shines

In September, production in U.S. factories increased more than expected, even though there were strikes in the automobile industry that limited the production of motor vehicles. This is additional proof that the economy finished the third quarter with strength. 

Positive Manufacturing Data

The Federal Reserve reported a 0.4% increase in manufacturing output last month. In contrast, the data for August was revised downwards, showing a 0.1% decrease in factory production, instead of the previously reported 0.1% increase. Economists surveyed by Reuters had predicted a 0.1% uptick in factory output

Year-on-Year Analysis

Looking at the year-on-year basis, production saw a 0.8% decline in September, with no change in the third quarter. Durable goods manufacturing output increased at an annualized rate of 2.3%, but this was offset by a 2.4% decline in nondurable manufacturing. 

Manufacturing Production MoM, FED by Ultima Markets MT4

(Manufacturing Production MoM, FED) 


Summary

In summary, the data for September 2023 highlights a resilient U.S. retail sector and a manufacturing industry that’s bouncing back from challenges. Consumers are spending with confidence despite rising prices, and manufacturers are adapting positively.

Staying informed and agile in these sectors is essential for businesses and investors looking to seize the opportunities presented by these trends.


Novo Nordisk Prosperity: Wegovy and Ozempic In The Spotlight


The Resilient Rise of Wegovy and Ozempic

The Danish pharmaceutical company, Novo Nordisk (NVO), has recently updated its financial outlook for the year due to the increasing demand for its weight loss drug, Wegovy, and diabetes medication, Ozempic.

These drugs are administered through weekly injections and have been sought after by patients for their significant weight loss effects. 

These two medical innovations have taken the pharmaceutical world by storm, delivering remarkable results for patients who have long sought effective solutions for their health concerns.


Novo Nordisk Market Triumph

Novo Nordisk’s financial outlook for the year has seen a remarkable revision, reflecting the surging popularity of Wegovy and Ozempic.

As demand for these life-changing drugs continues to grow, the company is now anticipating a substantial boost in sales.

Novo Nordisk’s revised forecast suggests a growth in sales between 32% to 38%, up from the previous estimate of 27% to 33%.

The company also anticipates an operating profit growth of 40% to 46%, an increase from the earlier prediction of 31% to 37%.

It’s evident that Novo Nordisk’s optimistic outlook is fueled by the unanticipated success of Ozempic, particularly in the U.S. market.


Novo Nordisk’s Stock Hit YTD High 

The popularity of Wegovy and Ozempic has propelled Novo Nordisk to become Europe’s most valuable company. The company’s U.S.-listed shares (ADR) also saw a new high for the year.

This exceptional market performance is a testament to the company’s unwavering commitment to improving the health and well-being of individuals around the world.

The market is keenly awaiting Novo Nordisk’s third-quarter earnings report, scheduled for release on November 2nd, which is expected to underscore the company’s impressive growth trajectory.


Strategic US$1.3B Acquisition: Ocedurenone

In a strategic move to further expand its portfolio and contribute to improved healthcare, Novo Nordisk has made a substantial acquisition.

Novo Nordisk has decided to buy the new drug called Ocedurenone for $1.3 billion from KBP Biosciences. The drug can help people with high blood pressure that is hard to control.

This acquisition, set to be finalized by the end of 2023, is anticipated to be a game-changer in the field of cardiovascular health. Importantly, it’s worth noting that this acquisition is not expected to affect Novo Nordisk’s overall profit for the year, ensuring that the company’s financial stability remains intact.

Novo Nordisk ADR YTD Chart By Ultima Markets MT4

(Novo Nordisk ADR YTD Chart) 

Novo Nordisk’s continuous commitment to pioneering medical breakthroughs, coupled with its exceptional market performance, solidifies its position as a key player in the pharmaceutical industry.

The company’s unwavering dedication to improving patients’ lives is reflected in their outstanding financial results and their strategic acquisitions, setting the stage for a promising future in healthcare.


Novo Nordisk Transformative Impact

In conclusion, Novo Nordisk’s success story is a testament to the transformative impact of Wegovy and Ozempic.

Their upwardly revised financial forecast, soaring stock performance, and strategic acquisitions are all indicators of a company that’s dedicated to making a meaningful difference in the lives of people worldwide.

As Novo Nordisk continues to innovate and meet the ever-growing healthcare needs of the population, its future prospects appear exceedingly bright.


For the latest news and updates, delve deeper into our articles.