U.S. Oil Production Fully Recovered from The Pandemic 

U.S. oil production hits record high 

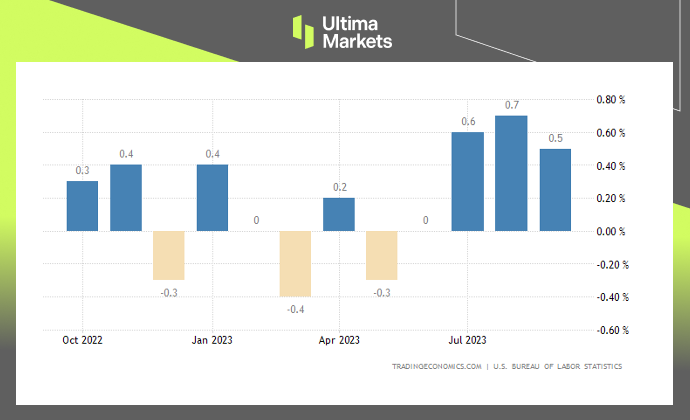
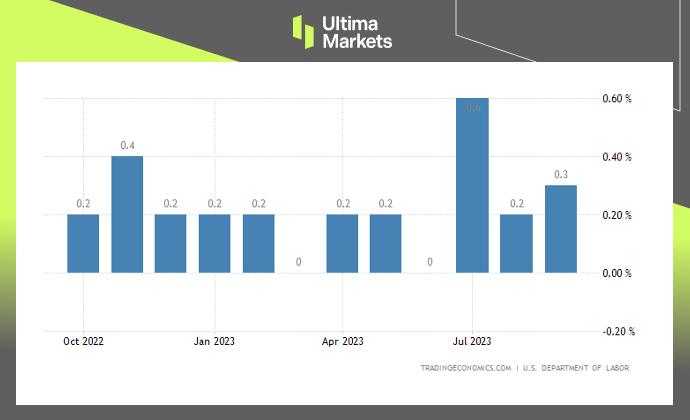
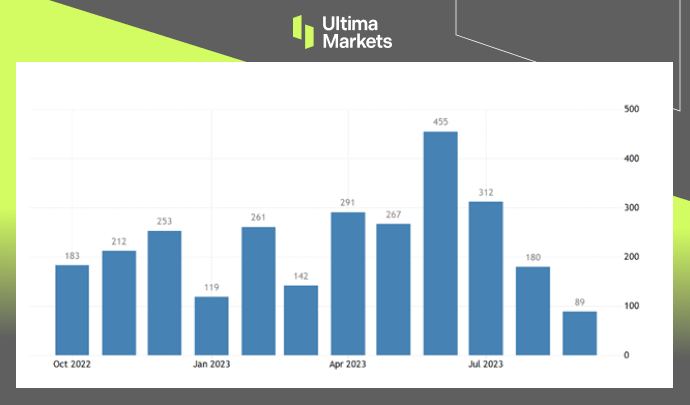
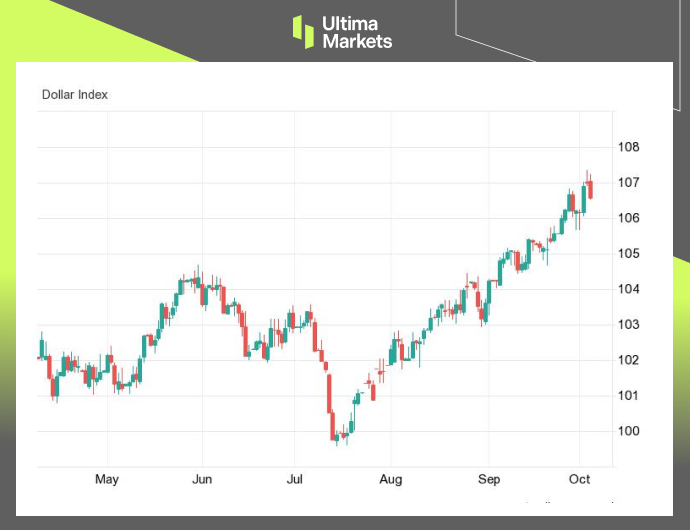
The U.S. Department of Energy announced on Oct. 12 that U.S. crude oil production had hit an all-time high of 13.2 million barrels per day, entirely wiping out Covid-era losses of more than 3 million barrels per day. Meanwhile, the S&P 500 Energy Index tripled after three and a half years.  

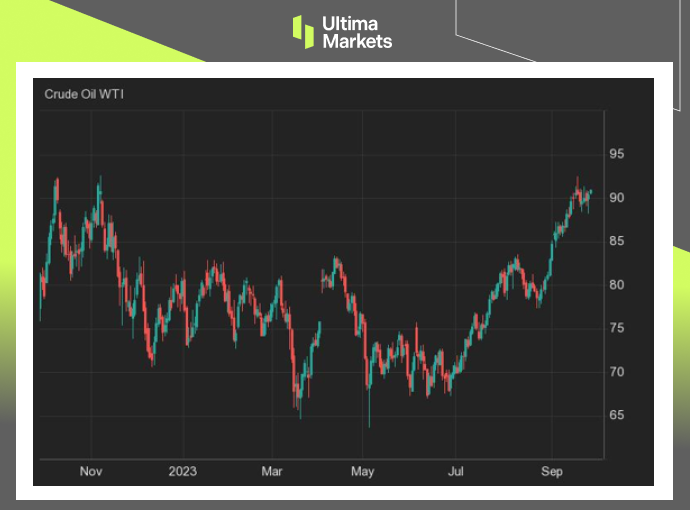
Oil demand has slowly rebounded after the 2020 downturn and lingering supply-chain shock. And rising prices for WTI crude – which careened during Covid to less than $15 a barrel, shot back to $120 in 2022, and is now near $90 – can make previously unprofitable plays work. 

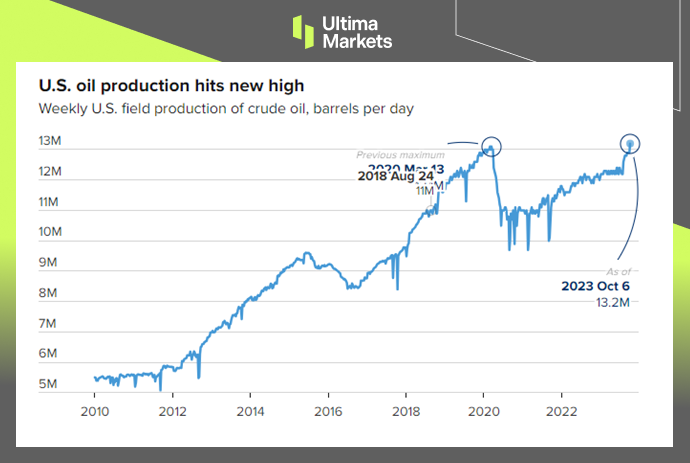
(US oil production,Energy Information Administration) 

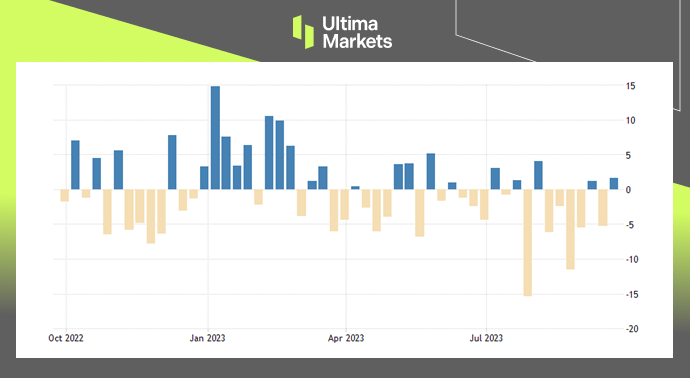
Oil companies conservative in capital spending 

U.S. oil companies cut capital spending to $106.6 billion last year from $199.7 billion in 2014, according to Statista, contributing to the decline in oil production and arguably delaying the recovery. And they put that money to work paying higher dividends and doing stock buybacks.  

According to Energy Department data, oil and gas companies paid about $75 billion per quarter last year. The department says the share of oil-company operating cash flow going to shareholders rose to half of operating cash flow from about 20% in 2019. 

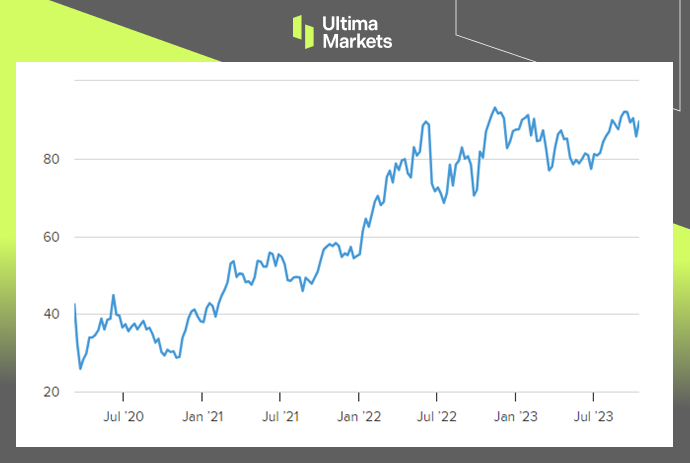
(S&P Energy Sector Index) 

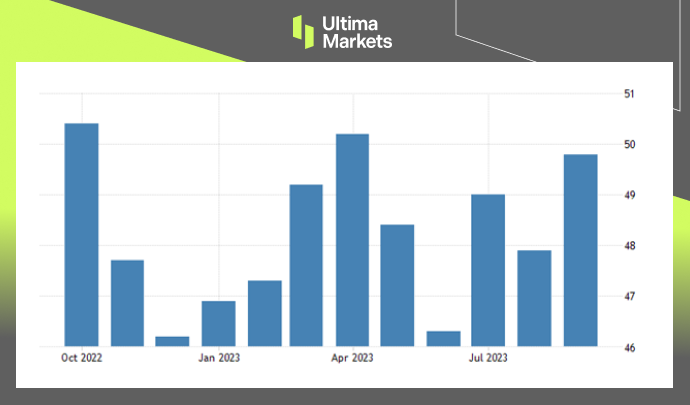
Higher productivity per crude well 

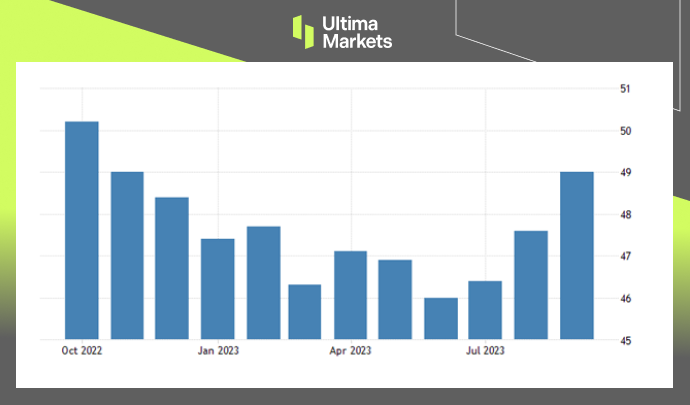
Offsetting the decline in capital spending is higher productivity per well — while all of the U.S. oil production is back, the closely watched Baker-Hughes rig count is barely half of 2018 levels. The average production per rig of new wells just topped 1,000 barrels a day, up from 668 four years ago, according to the Energy Department. So the industry didn’t have to add a ton of new wells or drill in as many new places to recover fully. 

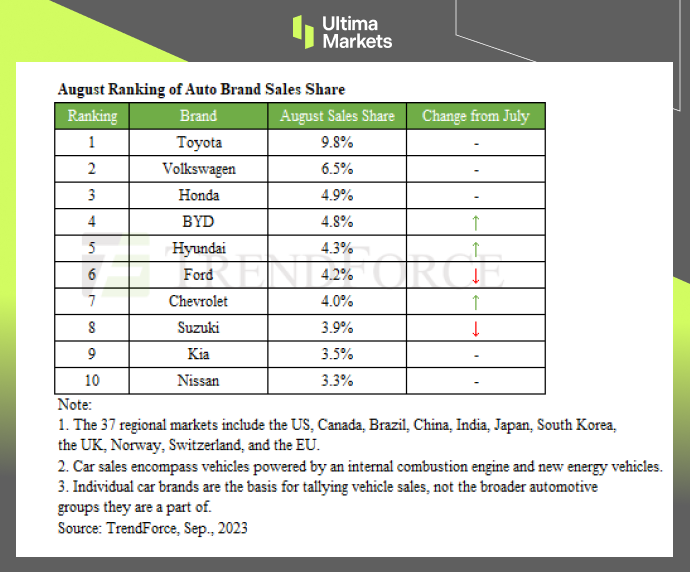
Even as more cars go electric, demand from older cars and uses of oil in chemicals will keep the oil business very large. “The U.S. production will rise to 13.6 million barrels per day next year and 13.9 million in 2025. After that, forecasts get more difficult because so much can change, but by late this decade oil consumption should peak before beginning to ebb”, Rystad Energy said. 

Disclaimer  

Comments, news, research, analysis, price, and all information contained in the article only serve as general information for readers and do not suggest any advice. Ultima Markets has taken reasonable measures to provide up-to-date information, but cannot guarantee accuracy, and may modify without notice. Ultima Markets will not be responsible for any loss incurred due to the application of the information provided. 

5 Benefits Joining a Live Trading Competition You Must Know

Why You Should Join A Live Trading Competition?

Winning prizes in every live trading competition is frequently the first thing traders will consider. Unsurprisingly, forex brokers will treat trading competitions like bonuses and give away incredible prize structures.  

For forex brokers, trading competition is one of the most successful promotional tools out there, which makes the competition unique in that it offers more than just money rewards. 

If you are considering joining a live trading competition today, this article will explain 5 benefits that you must know. 


1. Sharpening trading skills

Refining your trading skills is crucial whether you are a new trader with untested skills or seeking strategies to improve it. Enhancing your trading techniques and expertise might boost your confidence. 

In a volatile situation, for instance, confidence may suffer; therefore, improving your confidence will help you make trade decisions based on information and experience rather than emotion. 

Hence, a trading competition is the ultimate way to sharpen and test your trading skills against fellow traders worldwide.

Live competitions provide a real-world platform to hone your trading strategies, test your skills, and gain valuable experience. 


2. Experience gaining 

Reading about trading activities and methods can provide traders with a wealth of information.  

Live trading competition allows you to put your knowledge and techniques to the test, and the results might help you plan your future trading actions.  

In addition, the experience you gain will allow you to test your strategies on new currency pairs or transform theory and trading ideas into real trading opportunities. 


3. Assess strategies for risk management  

Risk management and loss mitigation are essential to trading success regardless of market conditions.  

Still, you may be wondering if your trading strategy is too conservative. Participating in a trading competition allows you to learn about the risks and benefits of methods you might not have tried otherwise.  

A live trading competition also allows you to test various risk management tactics and compare your performance to others to see how your strategies stand out. 


4. Help you learn more about yourself

Another great benefit of a live trading competition is to help you learn more about yourself. Successful people often emphasize what is in their control and focus on it. 

Trading is a multi-level experience that will help you better analyse any situation by considering risk or reward for each potential outcome of your choices.  

That is why you need to focus. A focus can provide a driving point that narrows your attention and helps you remove all distractions. 


5. Win attractive prizes 

This is what a participant in a competition is looking for, and being able to win attractive prizes for your trading skills and the profits you will make during the live trading competition.  

For example, Ultima Markets is now hosting the first-ever Live Trading Competition. It offers a chance to demonstrate your trading prowess in a real-time trading environment, compete against fellow traders, and win exciting prizes.  


Starting on 10 October 2023 and ending on 15 December 2023, ten participants who adhere to all contest rules and achieve the highest returns (based on the percentage increase in account equity) during the competition period will be declared the top winners for a US$50,000 in total prizes.  

Are you ready to participate in this most prestigious live trading competition? Click here to learn more about the Live Trading Competition


Disclaimer   

Comments, news, research, analysis, price, and all information contained in the article only serve as general information for readers and do not suggest any advice. Ultima Markets has taken reasonable measures to provide up-to-date information, but cannot guarantee accuracy, and may modify without notice. Ultima Markets will not be responsible for any loss incurred due to the application of the information provided.  

Copyright © 2023 Ultima Markets Ltd. All rights reserved. 

Higher Than Expected Inflation Data Strengthen FED’s Restrictive Policies 

FOMC meeting minutes published 

The U.S. Federal Reserve released the minutes of its September meeting on the 11th. To bring inflation back to the 2% target, maintaining a restrictive monetary policy is key. Most officials judged that it may be appropriate to raise interest rates again at future meetings. Some, however, believed that further interest rate hikes were not necessary. The minutes of the meeting also pointed out that the U.S. economy is expanding at a stable pace and the labor market is gradually reaching balance. However, inflation continues to be higher than the Federal Reserve’s target. Federal Reserve officials estimate that economic growth must fall below 1.8% to allow the trend of rising prices to be eased. 

Sep. PPI increased 0.5% MoM 

The U.S. Bureau of Labor Statistics also released inflation data. Producer prices in the US rose 0.5% month-over-month in September 2023, the least in three months, following a 0.7% rise in August, but above market forecasts of 0.3%. Goods prices were up 0.9%, prompted by a 5.4% surge in gasoline cost. 

(PPI MoM , U.S. Bureau of Labor Statistics) 

Sep. Core PPI increased 0.3% MoM 

Core producer prices in the United States were up by 0.3% over the previous month in September of 2023, following a 0.2% rise in the previous month and slightly above market expectations of a 0.2% increase. On a yearly basis, core consumer prices advanced by 2.7%, after an upwardly revised 2.5% rise in August and surpassing market estimates of a 2.3% increase, which might prompt the Federal Reserve to keep interest rates elevated for an extended period. 

( Core PPI MoM , US Bureau of Labor Statistics) 

Rising bond yields could reduce expectations for rate hikes 

FOMC has raised its benchmark interest rate 11 times to a target range of 5.25% to 5.5%, a 22-year high. Treasury yields have been rising sharply after the last meeting. If the situation persists, rising yields could eliminate the need for another rate hike. 

Disclaimer  

Comments, news, research, analysis, price, and all information contained in the article only serve as general information for readers and do not suggest any advice. Ultima Markets has taken reasonable measures to provide up-to-date information, but cannot guarantee accuracy, and may modify without notice. Ultima Markets will not be responsible for any loss incurred due to the application of the information provided. 

IMF believes the global economy is likely to have a “soft landing”

World economy to grow 3% YoY 

The International Monetary Fund (IMF) expects the world economy to grow by 3% this year as stronger-than-expected growth in the United States offsets lower prospects for China and Europe and cut its 2024 growth forecast by 0.1 percentage point to 2.9%. 

Fast economic recovery in the US 

The International Monetary Fund says: “The strongest recovery among major economies is the United States, which is increasingly consistent with a ‘soft landing’ scenario.” The agency expects the overall economic growth of the 20 countries using the euro to be 0.7% for 2023 and 1.2% next year; while China’s economy will grow by 5% this year and 4.2% in 2024, and specifically points out: “The crisis in China’s real estate industry may deepen and have global spillover effects, especially for commodity exporters.” In contrast, the U.S. economic growth forecast is raised to 2.1% in 2023 and 1.5% in 2024. 

Global inflation forecast raises to 6.9% 

The International Monetary Fund raises its global inflation forecasts for this year and next year by 0.1 and 0.6 percentage points to 6.9% and 5.8% respectively. Commodity prices pose “serious risks” to the inflation outlook and could become more volatile due to climate and geopolitical shocks. “Expectations of higher inflation in the future are likely to influence current inflation rates, keeping them high,” the IMF notes. 

Real estate impacted by high interests  

The International Monetary Fund also addresses that the prospect of “higher in the longer term” interest rates has led to sharp falls in house prices in some countries. Vulnerabilities in the commercial real estate sector “pose significant risks to the financial sector” and urge policymakers to assess the impact that a sharp drop in real estate prices could have on financial institutions. 

(GDP YoY Growth 2023,IMF) 

(GDP YoY Growth,IMF ) 

Red: developing economies,Yellow: World,Green: Advanced economies 

Disclaimer  

Comments, news, research, analysis, price, and all information contained in the article only serve as general information for readers and do not suggest any advice. Ultima Markets has taken reasonable measures to provide up-to-date information, but cannot guarantee accuracy, and may modify without notice. Ultima Markets will not be responsible for any loss incurred due to the application of the information provided. 

BYD Surpasses Ford in August 2023 Car Sales: Industry Insights 


BYD Overtakes Ford in August Car Sales: What Does It Mean for the Auto Industry?

According to TrendForce report, car sales in 37 markets around the world totaled 5.55 million units in August 2023, an increase of nearly 1% from July. The growth momentum came from the launch of new models for the autumn. 

A table shows the August Ranking of Auto Brand Sales Share.

(August Ranking of Auto Brand Sales Share)

The composition of the top ten brands is the same as last month. The top three are Toyota, Volkswagen, and Honda. The Chinese car manufacturer BYD replaced Ford and became the fourth-largest brand in August car sales.


BYD’s Remarkable Growth

BYD has converted all its models to new energy vehicles, so the lukewarm domestic demand in the Chinese market has less impact on it. BYD recorded a MOM growth of 5%, and the market share was only 0.1% behind the third-placed Honda.

However, Japanese car manufacturers also have contributions from markets such as Southeast Asia. Consequently, for BYD to surpass Honda in the global market, the key is its expansion speed in overseas markets.


Ford’s Decline in August Sales

Ford’s ranking fell to sixth place due to lower sales in Europe and the United States compared with the previous month, with sales declining by 6.7% month-on-month.  


Challenges and Variables in 2H23

Although the launch of autumn models will help new car sales, there are still many variables in 2H23, including the United Auto Workers (UAW) strike that has not yet ended; OPEC+ allies’ crude oil production cuts, etc.


Strategies for the Fourth Quarter

As the fourth quarter approaches, auto manufacturers will do their best to ensure smooth production, fulfill orders, and stimulate year-end sales, minimizing the impact of reduced order visibility caused by economic changes. 


Disclaimer  

Comments, news, research, analysis, price, and all information contained in the article only serve as general information for readers and do not suggest any advice. Ultima Markets has taken reasonable measures to provide up-to-date information, but cannot guarantee accuracy, and may modify without notice. Ultima Markets will not be responsible for any loss incurred due to the application of the information provided. 

USD’s Response to ADP® National Employment’s Sep’23 Report


Disappointing ADP Job Report’s Impact on USD | October 2023 Analysis

According to ADP® National Employment’s September 2023 Report, Private businesses in the US hired 89K workers in September 2023, the least since January 2021 when private employers shed jobs, and well below market forecasts of 153K. It follows a revised 180K increase in August, compared to an initial 177K.

Large establishments drove the slowdown, losing 83K jobs and wiping out gains they made in August. On the other hand, small companies added 95K jobs and mid-sized ones 72K. Meanwhile, annual wage growth slowed to 5.9%, the 12th consecutive monthly decline. Pay gains also shrank for job changers to 9%. 

US Employment Changes, ADP

(US Employment Changes, ADP)

The dollar index fell below the 107.0 mark on Wednesday, following the release of a disappointing ADP jobs report. Nevertheless, the dollar remained near its strongest level since November 2022, bolstered by hawkish comments from Fed officials that continue to reinforce expectations of elevated interest rates for an extended period. 

U.S. Dollar Index DXY

(U.S. Dollar Index DXY)


Disclaimer  

Comments, news, research, analysis, price, and all information contained in the article only serve as general information for readers and do not suggest any advice. Ultima Markets has taken reasonable measures to provide up-to-date information, but cannot guarantee accuracy, and may modify without notice. Ultima Markets will not be responsible for any loss incurred due to the application of the information provided. 

Global mobile phone shipments may continue to slide in 2H23 on weak demand 


Global Mobile Phone Production Decline in 2H23: Insights and Analysis

According to a TrendForce survey, after global smartphone production fell by nearly 20% year-on-year in the first quarter, production continued to decline by approximately 6.6% in the second quarter, to only 270 million units.

A total of 520 million smartphones were produced in the first half of 2023, a 13.3% decline compared to the same period last year. Both individual quarters and the first half of the year in total set a ten-year low. 


Factors Influencing Mobile Phone Production Decline

There are three reasons for the sluggish production performance:

1. China’s lifting of epidemic prevention restrictions has not boosted demand as expected.

2. The demographic dividend effect of the emerging Indian market has not effectively exerted its advantages. 

3. In 2022, brand names were severely hampered by excessive channel inventory. It was originally expected that as the inventory reduced, brand names would have returned to normal production levels. However, affected by the weak economy, people’s consumption willingness is more conservative, resulting in production performance in the first half of the year being less than expected. 


Top Six Global Smartphone Brands Challenges and Channel Inventory

(2Q23 global smartphone production and market share ranking) 

Samsung’s production performance in the second quarter was not as good as the same period last year. The total production in the second quarter was 53.9 million units, a quarter-on-quarter decrease of 12.4%, but it still ranked first in production.  

Apple is facing the transition of new and old models. The second quarter is probably the lowest production performance among the four quarters, with output of 42 million units, a quarter-to-quarter decrease of 21.2%. It is worth noting that Samsung and Apple are quite close in their full-year production forecasts. If the iPhone 15 series performs better than market expectations, it may overtake Samsung to become the number one brand in the global market.

Xiaomi’s output in the second quarter was approximately 35 million units, a quarterly increase of 32.1%, driven by the gradual decline in channel inventory and the launch of new models.  

A special change in the ranking is that Transsion overtook Vivo and entered fifth place in the world for the first time. Its production volume increased by more than 70% quarter-on-quarter to 25.1 million units.  


Outlook for the Global Smartphone Market

The overall economy has not fully recovered in the second half of the year, and demand in consumer markets such as China, Europe and the United States has not yet recovered significantly. Even if the economic indicators of the Indian market improve, it is still difficult to reverse the decline in global smartphone production.  


Disclaimer  

Comments, news, research, analysis, price, and all information contained in the article only serve as general information for readers and do not suggest any advice. Ultima Markets has taken reasonable measures to provide up-to-date information, but cannot guarantee accuracy, and may modify without notice. Ultima Markets will not be responsible for any loss incurred due to the application of the information provided. 

US PMI Improved, But Stagnant Inflation Loomed 


US Manufacturing PMI Shows Improvement, but Stagnant Inflation Remains a Concern

The ISM manufacturing purchasing managers’ index rose to 49 in September from 47.6 last month, well above market expectations of 47.8, reflecting the slowest contraction in the U.S. manufacturing industry in ten months.

Even as the economic slowdown improved, data still showed U.S. factory activity contracting on a month-on-month basis for nearly a year in a row, underscoring the impact of rising borrowing costs from the Federal Reserve on the industry.


Although new orders fell for the 13th consecutive month, the pace of decline slowed significantly as the changing supply chain environment pushed customers to take on more engineering (process).

Production rebounded from August’s stagnation and set the largest increase since July 2022. 

(ISM Manufacturing PMI, Institute for Supply Management) 


S&P Global US Manufacturing PMI

The S&P Global US Manufacturing PMI was revised higher to 49.8 in September 2023, surpassing the preliminary estimate of 48.9 and exceeding August’s final reading of 47.9.

The latest figure pointed to a fifth consecutive month of contraction in the sector’s health, albeit only fractional. Output increased at a marginal pace that was nonetheless the fastest since May.

In contrast, job creation remained moderate, and new orders continued to decline for the fifth consecutive month, reflecting the impact of high interest rates and inflation on consumer demand.


Inflation and Business Confidence

On the price front, both input costs and output charges accelerated, though inflation rates remained historically low, well below the levels seen over the past three years.

Moreover, business confidence reached its highest level since April 2022, driven by optimism about an impending improvement in demand conditions.  


Stagnant Inflation (Stagflation)

(US Manufacturing PMI, S&P Global) 

Based on the surveys, although survey data have improved overall, manufacturing reports show that production continues to slow down, and prices are accelerating again. The phenomenon presented is “stagnant inflation (Stagflation)“.


Disclaimer  

Comments, news, research, analysis, price, and all information contained in the article only serve as general information for readers and do not suggest any advice. Ultima Markets has taken reasonable measures to provide up-to-date information, but cannot guarantee accuracy, and may modify without notice. Ultima Markets will not be responsible for any loss incurred due to the application of the information provided. 

Top 10 IC Design Houses Recorded Revenue Up 12.5% QOQ, And Growth Is Expected To Extend In 3Q23 


The Rise of NVIDIA: A Dominant Force in IC Design

In the fast-paced world of integrated circuit (IC) design, the tides are constantly shifting, and the recent performance of the industry’s top players has been nothing short of remarkable.

According to TrendForce reports, fueled by an AI-driven inventory stocking frenzy across the supply chain, 2Q23 revenue for the top 10 global IC design powerhouses soared to US $38.1 billion, marking a 12.5% quarterly increase.

In this rising tide, NVIDIA seized the crown, officially dethroning Qualcomm as the world’s premier IC design house, while the remainder of the leaderboard remained stable.  

(2Q23 World’s top 10 IC design houses, TrendForce) 

NVIDIA: The New Kingpin

NVIDIA benefited from global CSPs (cloud service providers), internet company and enterprise generative AI, large-scale language model import application demands, and its data center revenue increased by as much as 105% quarterly.

In addition, revenue from gaming and professional visualization businesses also continued to grow, driven by new products.

Overall, revenue in the second quarter reached US$11.33 billion, a quarterly increase of 68.3%.   


Qualcomm’s Challenges

Qualcomm’s Q2 took a hit as the Android smartphone sector grappled with dwindling demand and Apple’s modem pre-purchases resulted in a subdued seasonal rhythm.

Consequently, their revenue slid by 9.7%, rounding off at about US$7.17 billion. 


Broadcom’s Mixed Bag

Broadcom benefited from the sales of high-end switches and routers catalyzed by generative AI, its NetCom business increased by about 9% quarterly.

However, offset by the decline in server storage, broadband, and wireless business, the second quarter revenue was roughly the same as the previous quarter at about $6.9 billion.  


AMD’s Steady Stance

AMD’s overall second-quarter revenue was roughly the same as the previous quarter at about US$5.36 billion, due to the decline in gaming GPU sales and embedded business in the second quarter.  


The Outlook for IC Design Houses

Although the inventory levels of semi-companies have improved significantly compared with those in 1H23, the outlook for the second half of the year tends to be conservative because of the weak market demand.

It is worth noting that the wave of generative AI and large-scale language model deployment has emerged among Internet companies and private enterprises.

It is expected that AI will be more helpful to related supply chain operations in the second half of the year, and the average sales unit price of such products will be higher than that of consumer products.

As a result, the world’s top ten IC design revenue will continue to have double-digit quarterly growth in the third quarter, and the output value is expected to reach a new high. 


Disclaimer  

Comments, news, research, analysis, price, and all information contained in the article only serve as general information for readers and do not suggest any advice. Ultima Markets has taken reasonable measures to provide up-to-date information, but cannot guarantee accuracy, and may modify without notice. Ultima Markets will not be responsible for any loss incurred due to the application of the information provided. 

Supply Chain Tensions Causes Crude Prices To Hover Higher 


How Supply Chain Tensions Impact Crude Oil Prices in October 2023

The American Petroleum Institute’s weekly statistical report shows that U.S. crude oil inventories increased by 1.586 million barrels in the week ending September 22, 2023, after a decrease of 5.25 million barrels in the previous week.

WTI crude futures rebounded to $90.7 a barrel, hovering at their highest level since November. The prospect of tight supplies helped markets shake off worries about rising interest rates and their impact on the economy.

The $90 pivot point is psychologically important and reinforces the belief that the market is poised for further upside.

Additionally, crude oil tends to perform well in inflationary environments as investors seek refuge in tangible assets rather than currencies. 

(United States API Crude Oil Stock Change) 

(WTI crude Daily chart) 


Disclaimer  

Comments, news, research, analysis, price, and all information contained in the article only serve as general information for readers and do not suggest any advice. Ultima Markets has taken reasonable measures to provide up-to-date information, but cannot guarantee accuracy, and may modify without notice. Ultima Markets will not be responsible for any loss incurred due to the application of the information provided.