Singapore’s PMI Moderate Growth, Index Hits 1.2-Year High


Singapore’s Manufacturing Sector: A Resilient Recovery and Soaring Confidence

In the ever-evolving landscape of Singapore’s manufacturing sector, the latest data paints a promising picture of recovery and growth.

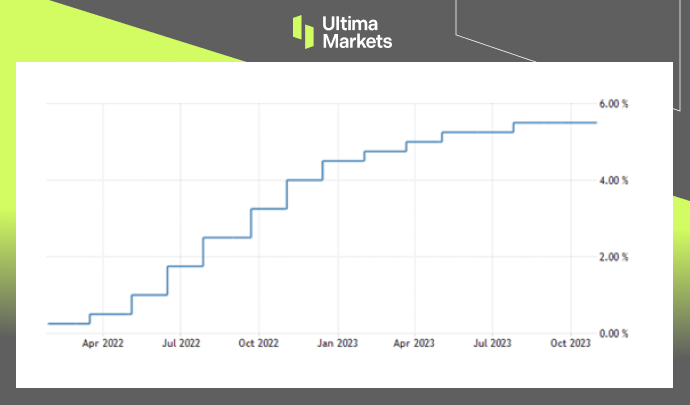
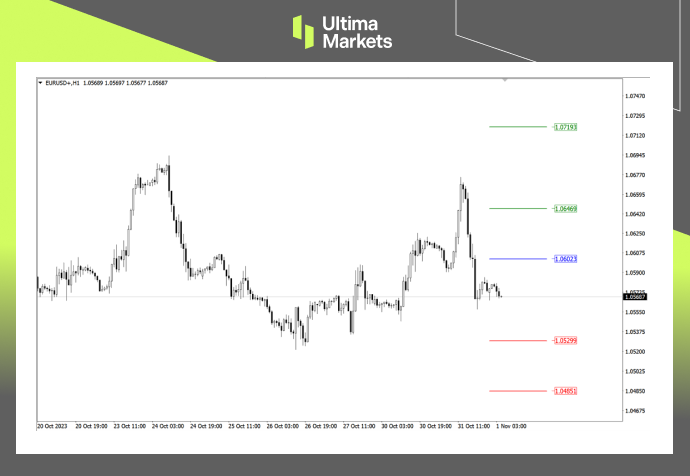
The Purchasing Managers’ Index (PMI) for October 2023 inched up slightly to 50.2, marking the second consecutive month above the pivotal 50-point threshold.

This upward trend signals a robust recovery and an expansion of factory activity, underlining the resilience of Singapore’s manufacturing landscape.


Steady Gains in Key Metrics

Crucial metrics such as factory output, new exports, and employment have witnessed positive developments, indicating a steady climb back to pre-contraction levels. This optimistic trend is particularly encouraging given the recent six-month contraction period.

Despite the challenges posed by sluggish external demand, the manufacturing sector is demonstrating its ability to adapt and thrive.

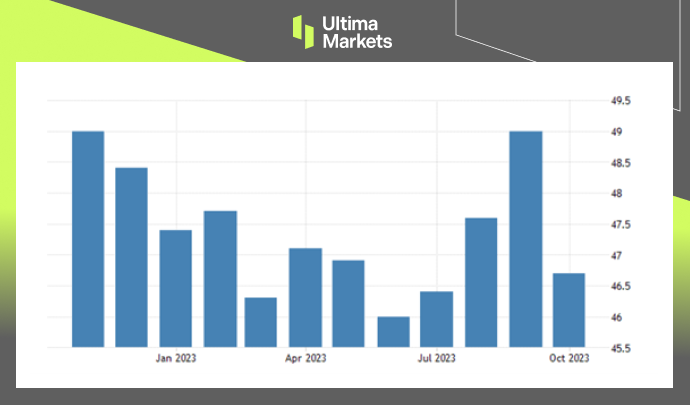
Simultaneously, the electronics sector, which accounts for approximately 40% of Singapore’s industrial output, saw its activity decline for the 15th consecutive month in October. However, the rate of decline moderated slightly, with a reading of 49.9 compared to 49.8 in September.  

Singapore Manufacturing PMI, SIPMM Graph

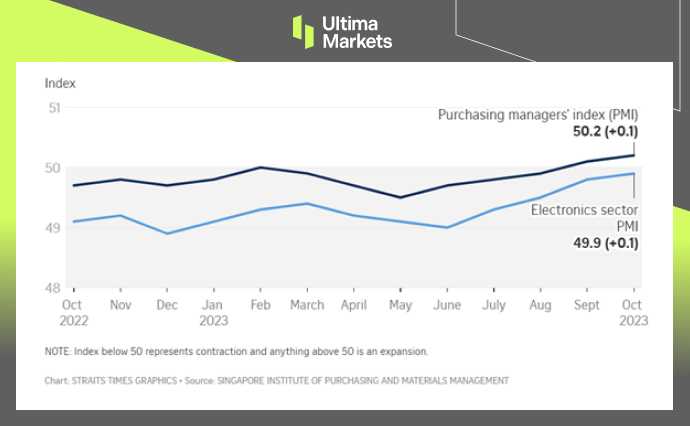
(Singapore Manufacturing PMI, SIPMM)

Factory Output Takes Center Stage

Factory output, a cornerstone of manufacturing vitality, has shown notable improvement. The positive momentum suggests increased production activities, reflecting not only a recovery but also a potential uptick in consumer demand.

This bodes well for the overall economic landscape, as manufacturing often serves as a barometer for broader economic health.

New Exports Signal Global Relevance

The uptick in new exports is another noteworthy aspect of Singapore’s manufacturing resurgence. Despite external challenges, the sector is positioning itself on the global stage, showcasing its resilience and adaptability.

This is a testament to the competitiveness of Singaporean products in the international market.

Employment on the Rise

A positive correlation between increased factory activity and employment growth is a pivotal marker of a thriving manufacturing sector. As the manufacturing landscape expands, job opportunities follow suit, contributing to the overall economic well-being of the nation.


Navigating Challenges: A Balanced Outlook

While the overall trajectory is positive, it’s crucial to acknowledge and address the challenges that persist. Despite improvements, input purchases and new orders continue to contract, influenced in part by the economic deceleration in China and geopolitical tensions.

Additionally, supplier deliveries have experienced deterioration, reflecting the interconnected nature of global supply chains.

Electronics Sector: A Mixed Bag

The electronics sector, a significant contributor to Singapore’s industrial output, witnessed a decline for the 15th consecutive month in October. However, the rate of decline moderated slightly, signaling potential stabilization. This nuanced perspective underscores the sector’s resilience amid external pressures.


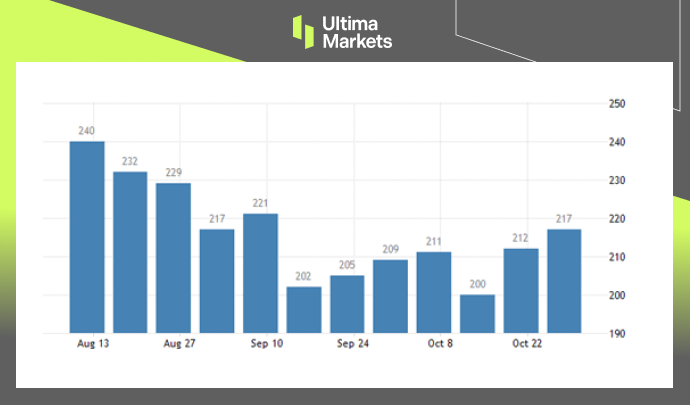
Business Confidence: Reaching New Heights

Beyond the numbers, the third quarter of 2023 brought a surge in business confidence, reaching its highest level in 18 months. This surge, from a confidence index of 6 to 7, signifies a renewed optimism within the manufacturing community.

Business Confidence, Singapore Department of Statistics Bar Chart

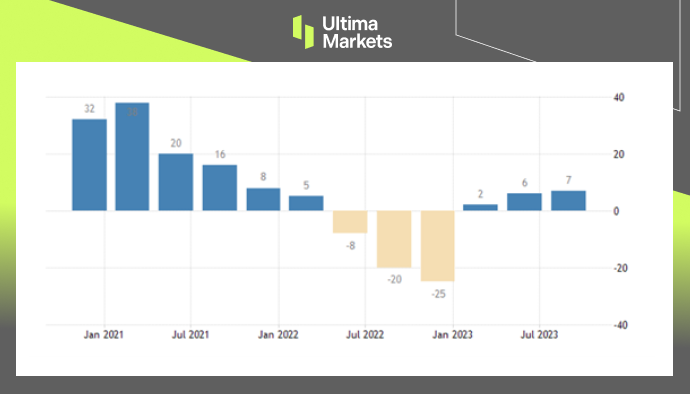
(Business Confidence, Singapore Department of Statistics) 

Electronics Industry: A Driving Force

The electronics industry, particularly the semiconductor segment, emerged as a major driver of this newfound confidence. The confidence index soared from 11 in the second quarter to an impressive 23 in the third quarter.

This surge underscores the pivotal role of semiconductors in shaping the outlook of the manufacturing sector.

General Manufacturing: Diverse Optimism

Diversification of optimism is evident in the general manufacturing sector, where an overall increase from -8 to 6 is observed. This shift is primarily attributed to positive sentiments surrounding food, beverages, and tobacco manufacturing.

The sector’s ability to adapt and pivot towards areas of demand is a testament to its resilience.


Sector-Specific Variances: A Nuanced Landscape

While overall confidence rose, specific sectors experienced divergent trends. The transport engineering sector witnessed a dip from 43 to 35, signaling a need for strategic adjustments.

Similarly, assessments for the chemicals, biomedical manufacturing, and precision engineering segments saw fluctuations, highlighting the importance of targeted strategies for sustained growth.

In conclusion, Singapore’s manufacturing sector is on a trajectory of resilience and recovery. The positive indicators across key metrics and the surge in business confidence underscore the adaptability and strength of the sector.

As challenges persist, addressing them with strategic precision will be paramount in ensuring a sustained and robust manufacturing landscape for Singapore.


Focus on AUD/USD Today – 7th November 2023 


Comprehensive AUD/USD for November 7, 2023

In this comprehensive analysis, Ultima Markets brings you an insightful breakdown of the AUD/USD for 7th November 2023. 


Key Takeaways

  • Changes in the RBA’s monetary policy: The Reserve Bank of Australia will announce its latest interest rate decision at noon. Due to the unexpectedly strong CPI in Australia in the third quarter and the rebound in housing prices to near record highs, the market expects that the possibility of the Reserve Bank of Australia raising interest rates by 25 basis points this week reaches 60% %. On the contrary, if there is no sign of tightening in monetary policy, AUD/USD will enter a rapid downward trend. 
  • Bullock has a hawkish attitude: The new chairman of the Reserve Bank of Australia, Bullock, said in a public speech that “if the inflation outlook shows a substantial increase, we will not hesitate to further raise the cash rate.” Expectations that the Reserve Bank of Australia will resume raising interest rates have triggered a strong rise in the Australian dollar recently. 

AUD/USD Technical Analysis 


AUD/USD Daily Chart Insights

AUD/USD Daily Chart Insights by Ultima Markets MT4
  • Stochastic Oscillator: The indicator has entered the overbought area, indicating the strength of the current bullish trend. Although there were signs of a reversal yesterday, we cannot judge that a reversal is coming without confirmation. 
  • Moving average: After the exchange rate strongly breaks through the 33-day moving average and the 65-day moving average, it hints that the current bullish trend is coming, and the resistance level is looking towards the 200-day moving average (dashed line). There is a certain probability of going back to the green 5-day moving average. 

AUD / USD 1-hour Chart Analysis

AUD/ USD 1-hour Chart Analysis by Ultima Markets MT4
  • Stochastic oscillator: The indicator is still in the oversold area. Judging from the market trend, it is currently in the consolidation stage. Wait for the indicator to show a long signal before paying attention to whether there are trading opportunities. 
  • Price Action: After consolidation for two trading days, the market formed a rectangular range. After falling below the range, the exchange rate will most likely continue to decline in the short term. Pay attention to the support price below. 
  • Support price: The red 65-period moving average is the first target support level. If the market enters a deep correction, continue to look at the upper edge of the upward channel line. 

Ultima Markets MT4 Pivot Indicator

Ultima Markets MT4 Pivot Indicator for AUD/USD
  • According to the pivot indicator in Ultima Markets MT4, the central price of the day is established at 0.64993, 
  • Bullish Scenario: Bullish sentiment prevails above 0.64993, first target 0.65131, second target 0.65371; 
  • Bearish Outlook: In a bearish scenario below 0.64993, first target 0.64752, second target 0.64608. 

Conclusion 


The Canadian Dollar Recovered from One-Year-Low of Weak USD


CAD Bounced, But Appreciation Capped 

The Canadian dollar has strengthened to 1.37 per USD, bouncing back strongly from the one-year low of 1.39 reached on November 1st.

This recovery was strengthened by a general retreat in the DXY index, as weak economic data from the US reinforced the Federal Reserve’s indications that they may hold off on further interest rate hikes.

However, the appreciation was limited by disappointing domestic economic data, which increased expectations of a less aggressive stance by the Bank of Canada (BoC).

(USD/CAD Six-month Chart) 


CAD Resurgence: Unveiling the Drivers

The rebound in the CAD is primarily driven by external macroeconomic factors:

DXY Index Retreat: The decline in the DXY index, which measures the USD’s strength against major currencies, is a pivotal factor.

This decrease in USD strength is linked to weak economic data from the United States, reinforcing the Federal Reserve’s inclination toward a more prudent approach to interest rate hikes.

This decline in USD strength has provided essential support for the CAD’s appreciation.


Domestic Economic Headwinds: Understanding the Constraints

The CAD’s upward momentum is hindered by domestic economic challenges:

  • Rising Unemployment: Canada’s unemployment rate surged to 5.7% in October, the highest level in 21 months. This unexpected increase has raised concerns about the stability of the Canadian labor market.
  • Sluggish Wage Growth: The ongoing deceleration in wage growth is a significant issue. Slower wage growth affects consumer spending and economic sentiment, adding to uncertainty in the market.
  • Faltering Job Creation: Job creation in Canada has fallen short of expectations, highlighting a pronounced weakness in the labor market. The inability to meet job creation projections amplifies concerns about the overall health of the Canadian economy.

Bank of Canada’s Approach: Navigating Economic Waters

The role of the Bank of Canada is paramount in shaping the CAD’s trajectory:

  • Interest Rate Policy: In a recent meeting, the BoC opted to maintain unchanged interest rates. However, the central bank has expanded its flexibility regarding future rate hikes. This shift indicates the BoC’s concern about the repercussions of previous tightening measures.
  • Dampened Demand and Inflation: The BoC has recognized that previous rate hikes have curbed demand and restrained inflation. This suggests a more measured approach to monetary policy, striking a balance between stimulating economic growth and managing inflation.

Conclusion: An Insightful Perspective

To sum up, the CAD’s resurgence from a one-year low is underpinned by a complex interplay of external and domestic factors.

While the retreat of the DXY index and the Federal Reserve’s policy stance have buoyed the CAD, the constraints of a challenging labor market and the BoC’s nuanced policy approach remain substantial challenges.

Staying vigilant in monitoring these factors is vital for investors and businesses as they navigate the intricate financial landscape.


Explore Ultima Markets News Hub

Stay Informed with the Latest Updates – Dive into Our Articles


Disclaimer   

Comments, news, research, analysis, price, and all information contained in the article only serve as general information for readers and do not suggest any advice. Ultima Markets has taken reasonable measures to provide up-to-date information, but cannot guarantee accuracy, and may modify without notice. Ultima Markets will not be responsible for any loss incurred due to the application of the information provided.  

Copyright © 2023 Ultima Markets Ltd. All rights reserved. 

Understanding the Recent Surge in GBP Value


The Impact of BOE and FED Decisions on the British Pound and Economy

The British pound has seen a remarkable resurgence in recent times, climbing above the $1.23 mark against the US dollar. This is the highest level for the pound since mid-October 2022.

The rise can be attributed to key decisions and outlooks from both the Bank of England (BOE) and the US Federal Reserve.


Factors Driving the Pound’s Rise

Several factors related to the stances of the BOE and Fed have contributed to lifting the pound:

  • Fed holds interest rates steady – The Fed’s decision not to raise rates further due to signs of slowing US job growth has boosted confidence in the pound as an investment option compared to the dollar.
  • BOE maintains firm interest rate stance – By holding its key rate at a 15-year high of 5.25%, the BOE has signaled its commitment to stability and shored up faith in the pound.
  • Reassurance from Governor Bailey – Comments from BOE Governor Andrew Bailey signaling no near-term rate cuts and upholding guidance on further hikes has reinforced the bank’s position.
GBP/USD 1-year Chart By Ultima Markets MT4

(GBP/USD 1-year Chart) 


Bank of England Outlook and Policy

The BOE has provided clarity around its monetary policy outlook and intentions:

  • No rate cuts expected soon – Bailey has indicated rate reductions are not on the horizon, offering certainty to markets.
  • Potential 3 quarter-point cuts by end 2024 – Markets speculate up to 75 basis points in cuts could come in 2024 as the BOE eyes the weak growth outlook.
  • On track to meet inflation target – BOE forecasts show inflation is slated to halve by year-end to meet the 2% target.
  • Inflation to remain above target until late 2025 – Projections see inflation at 3.1% in Q4 2024 before declining to 1.9% in Q4 2025, underscoring the bank’s anti-inflation stance.

Bank of England Interest Rate Projections

PeriodInterest Rate Projection
Q4 20225.25%
Q4 20234.50%
Q4 20243.75%
Q4 20253.00%
These data are from Bank of England
United Kingdom Interest Rate by Bank Of England

(United Kingdom Interest Rate, BOE)


Economic Headwinds Facing the UK

While positive for the pound, the BOE has cautioned around significant challenges for the UK economy:

  • Q3 growth stagnation – Economic expansion stalled in the third quarter of 2022.
  • Minimal Q4 growth expected – Forecasts show just 0.1% GDP growth to close out 2022.
  • Subdued 2023 growth outlook – The BOE sees the UK economy contracting throughout 2023.
  • High energy costs hit output – Expensive energy is forcing firms to cut back production.
  • Labor market concerns – Despite low unemployment, weak wage growth and poor productivity weigh on the economy.
  • Global slowdown impacts exports – Weaker EU and US markets are dampening demand for UK exports.

Impact on the British Pound

The pound’s rally indicates it remains an attractive safe-haven currency investment despite clouds on the UK’s economic horizon:

  • BOE policy credibility supports pound – The central bank’s consistency and transparency in laying out its policy intentions instills market trust in the pound.
  • UK rate advantage persists over dollar – The Fed being closer than the BOE to ending its tightening cycle preserves higher yield appeal for sterling.
  • Inflation fight remains intact – The BOE’s commitment to getting inflation down reinforces the pound as a stable store of value.
  • Economic challenges mainly priced in – Markets have largely priced in the headwinds facing the UK economy, limiting downside for the pound.

Conclusion

In summary, the BOE and Fed’s policy signaling has provided key support for the British pound’s surge above $1.23.

Despite economic struggles ahead, the UK central bank’s firm anti-inflation stance and rate advantage over the dollar are likely to continue underpinning sterling strength.

However, further dollar gains on aggressive Fed tightening or an unanticipated BOE pivot on rates pose risks.

Overall, the pound looks set to remain on solid footing as long as the BOE maintains policy credibility.


Focus on Brent Oil Today – 3rd November 2023 


Comprehensive Brent Oil for November 3, 2023

In this comprehensive analysis, Ultima Markets brings you an insightful breakdown of the Brent Oil (UKOUSD) for 3rd November 2023.


Key Takeaways 

  • Russian supply increases: Tanker tracking data monitored by foreign media show that Russia’s seaborne crude oil exports have been exceeding the country’s export target as part of the OPEC+ agreement for several weeks. Observed exports in the most recent week were 360,000 barrels per day above target exports. In the most recent period, four-week average daily exports were nearly 200,000 barrels per day above that level.
  • The impact of the Israeli-Palestinian conflict is gradually weakening: Traders are still worried that something will cause the conflict to spread beyond Israel and its immediate neighbors. But that influence has steadily waned, even after Israel began its ground offensive in Gaza. 

Brent Oil Technical Analysis 


Brent Oil Daily Chart Insights

Brent Oil Daily Chart Insights by Ultima Markets MT4
  • Stochastic Oscillator: The fast line is about to cross the slow line, suggesting that the current bullish power may have the upper hand. However, we are still temporarily bearish until there is a clear signal. 
  • Price Action: After oil prices showed a pin bar on Wednesday, the closing line showed a typical harami price action yesterday. If it breaks through the high point of the pin bar today, the bulls will clearly have the upper hand, and the market may reverse upward. 
  • Moving average: The black 65-day moving average and the green 240-day moving average form a rectangular range. A breakthrough in any direction of the range may be the next trend direction. 

Brent Oil 1-Hour Chart Analysis

Brent Oil 1-Hour Chart Analysis By Ultima Markets MT4
  • Support and resistance price: The current resistance of oil price is a repeatedly verified downward trend line, and the bottom is the black 65-period moving average potential support level. 
  • Fibonacci retracement level: Since the internal structure of yesterday’s upward trend is a complete 5-wave structure, it is temporarily judged to be a driving wave. Wait for the market to fall back to the Fibonacci retracement level of 38.2% to observe whether there is a signal to continue to rise.  
  • Stochastic Oscillator: It is worth noting that the indicator is currently seriously overbought, and there is a certain probability of a correction during the Asian session. 

Ultima Markets MT4 Pivot Indicator

Ultima Markets MT4 Pivot Indicator for Brent Oil
  • According to the pivot indicator in Ultima Markets MT4, the central price of the day is established at 87.361, 
  • Bullish Scenario: Bullish sentiment prevails above 87.361, first target is 89.077, second target is 89.769. 
  • Bearish Outlook: In a bearish scenario below 87.361, first target 86.688, second target 84.991. 

Conclusion 

US Stock Market’s Recent Surge Thanks To Cool Labor Market


The Bright Outlook for US Stocks: A Market Analysis

In November 2023, the US stock market witnessed a significant upswing, reinforcing expectations of an end to the era of rate hikes.

The Dow Jones index soared by more than 560 points on November 2nd, marking its most remarkable daily gain since June. Simultaneously, the S&P recorded a 1.89% surge, its most substantial single-day increase since April. The Nasdaq also celebrated a robust performance, closing 2.36% higher, its best showing since July.

This impressive market rally was underpinned by gains in the energy and real estate sectors, both of which secured advances exceeding 3.0%. These substantial gains contributed to all eleven S&P sectors concluding the session on a positive note.


US Stocks Saw Strong Buying Across Sectors 

The momentum behind these stock market surges is closely tied to growing expectations regarding the Federal Reserve’s future monetary policy.

As this sentiment gains traction, investors and market participants are becoming increasingly confident that the central bank is nearing the completion of its rate-hiking efforts.

Additionally, the benchmark US 10-year yield fell to its lowest level in three weeks, reaching 4.65%. This decline further signifies the market’s anticipation of a more accommodative monetary stance


Robust Sector Performance

One of the most notable aspects of this remarkable stock market rally is the broad-based nature of the gains. Notably, the energy and real estate sectors exhibited exceptional strength, each securing advances exceeding 3.0%.

These gains underscore the market’s confidence in the economic outlook and support the view that the recovery remains firmly on track.

Sector Performance by Bloomberg

(Sector Performance, Bloomberg) 


Signs of a Weakening Job Market

While the stock market flourishes, the job market faces challenges, which require close scrutiny:

  • Unemployment Claims: The number of Americans applying for unemployment benefits increased to 217,000, surpassing market estimates. This indicates that unemployed individuals are encountering difficulties in finding employment.
  • Continuing Jobless Claims: Continuing claims rose to 1,818,000, exceeding market expectations. These figures align with signals from the Federal Reserve, suggesting that labor market conditions are softening.
  • Nonfarm Payrolls: All eyes are now on the upcoming nonfarm payrolls report, with economists predicting an increase of 180,000 jobs in October, following a substantial gain in September. This report will provide crucial insights into the job market’s health.
Initial Jobless Claims by United States Department of Labor

(Initial Jobless Claims, United States Department of Labor) 


Bottom Line

In conclusion, the US stock market’s recent surge is a significant development with far-reaching implications. As the market regains strength, it underlines the growing confidence in a more accommodative monetary policy by the Federal Reserve.

However, it’s vital to balance this optimism with the challenges in the job market, as signs of weakness in unemployment claims and continuing claims signal potential hurdles in the economic recovery.

The interplay between these factors will undoubtedly shape the trajectory of the US economy in the months to come.


FED’s Latest Move and November 2023’s ISM Manufacturing PMI


The Impact of FED’s Decision and ISM Manufacturing PMI in November 2023

In November 2023, the Federal Reserve (FED) once again held its rates unchanged, marking the second consecutive time for such a decision. Investors and financial experts alike anticipated and conjectured about this FED move.

In addition, the Manufacturing Purchasing Managers Index (PMI) for October was released by the Institute for Supply Management (ISM), providing insight into the status of the US manufacturing industry.


Key Takeaway: FED’s Inflation Concerns

The FED’s Response to Inflation

The foremost concern addressed by the FED was the persistence of high inflation. FED Chairman Jerome Powell emphasized that inflation had exceeded the FED’s long-term target of 2%. Specifically, the total Personal Consumption Expenditures (PCE) prices had surged by 3.4% over the 12 months ending in September.

Federal Funds Rate, FED by Ultima Markets MT4

(Federal Funds Rate, FED)

Monetary Policy Consideration

Powell’s statement shed light on the FED’s approach to managing inflation. He articulated that any future rate hikes would be executed with great caution, considering factors such as the cumulative impact of prior rate adjustments, the time lag in the transmission of monetary policy effects, and the prevailing economic and financial market conditions.

Market Impact: USD Index Decline

Following the FED’s announcement, the USD index (DXY) experienced a noticeable decline, moving from 106.66 to 106.35. This underscores the strong correlation between the FED’s monetary policy decisions and currency markets, making them of paramount importance to traders and investors.


Insights into ISM Manufacturing PMI for October 2023

The Escalating Contraction

The ISM’s Manufacturing PMI data for October 2023 unveiled a worrisome trend. The U.S. manufacturing sector continued to contract, with the pace of contraction intensifying. The PMI declined by 2.3%, reaching 46.7%, in contrast to the 49% recorded in September, emphasizing the sector’s ongoing challenges.

Manufacturing Purchasing Managers Index PMI, ISM By Ultima Markets MT4

(Manufacturing Purchasing Managers Index PMI,ISM)

Decline in New Orders

A critical factor contributing to the sector’s struggles is the downturn in new orders. Firms are grappling with reduced demand for their products, which has a detrimental impact on production and overall growth.

Challenges in Export Orders

While there was a moderate rise in the new export orders index, it remained within contraction territory. This suggests that the international market is not providing the expected boost to U.S. manufacturers.

Backlogs of Orders: A Persistent Issue

The backlogs of orders index also saw a slight decline, maintaining its position within sharp contraction territory. This signifies that manufacturers are contending with the backlog of existing orders, which can have ripple effects on future production.


Bottom Line

In conclusion, the FED’s unwavering stance on interest rates and the ISM Manufacturing PMI for October 2023 offer essential insights into the state of the U.S. economy. Staying well-informed about these developments is vital for making sound financial decisions in a constantly evolving economic landscape.


Focus on USD/CAD Today – 2nd November 2023 


Comprehensive USD/CAD for November 2, 2023

In this comprehensive analysis, Ultima Markets brings you an insightful breakdown of the USD/CAD for 2nd November 2023. 


Key Takeaways 

  • Federal Reserve’s attitude: The interest rate decision of Federal Reserve did not change the policy interest rate as expected. Fed members have been working hard to balance the two risks. They do not want to raise interest rates too much and cause an unnecessary deep recession, nor do they want to accelerate inflation again or stabilize well above the 2% target. 
  • The Canadian dollar may be favored: The Canadian employment survey shows that the labor market continues to be tight and wages continue to rise significantly. The unexpectedly strong data raised the possibility of further interest rate hikes from the Bank of Canada, while the prospect of higher oil prices also increased the likelihood of a higher Canadian dollar. 

USD/CAD Technical Analysis 


USD/CAD Daily Chart Insights

USD/CAD Daily Chart Insights by Ultima Markets MT4
  • Stochastic Oscillator: After the indicator formed a short signal in the overbought area, it began to turn downward yesterday, suggesting that the exchange rate may begin to decline. 
  • Price Action: After the exchange rate fluctuated at a high level for four trading days, it closed as a small doji candle yesterday. If it finally closes the dark candle bar today, the market may adjust downward in the future. 
  • 5-day moving average: The 5-day moving average has supported the continuous upward trend. If the market closes below the 5-day moving average, the upward trend of the exchange rate will end in the short term. 

USD/CAD 1-hour Chart Analysis

USD/CAD 1-hour Chart Analysis by Ultima Markets MT4
  • Stochastic oscillator: The indicator is still in the oversold area, and there is no bull signal, suggesting that the current short forces have the upper hand and cannot easily choose to buy the bottom. 
  • Price Action: Since October 31st, it has fluctuated at high levels to form a rectangular range. After the market fell below the range, the red 65-period moving average failed to support the decline. The next target of the market is the black support line, which may also be the 200-period moving average. 

Ultima Markets MT4 Pivot Indicator

Ultima Markets MT4 Pivot Indicator for USD/CAD
  • According to the pivot indicator in Ultima Markets MT4, the central price of the day is established at 1.38655, 
  • Bullish Scenario: Bullish sentiment prevails above 1.38655, first target 1.38898, second target 1.39233; 
  • Bearish Outlook: In a bearish scenario below 1.38655, first target 1.38321, second target 1.38076. 

Conclusion 

The Surge of Bitcoin: A Phenomenal October Rally


The Bitcoin ETF Hype

In October, cryptocurrency prices increased significantly, especially for bitcoin. Bitcoin had its biggest monthly hike since January.

Investors were excited about the possibility that bitcoin exchange-traded funds (ETFs) may soon be approved in the United States. ETF offers easy and affordable access for the average investor as compared to investing in cryptocurrency itself or existing products. 


The Bitcoin ETF Revolution

Simplifying Crypto Investments

Bitcoin ETFs, once approved, have the power to reshape the way individuals engage with cryptocurrencies. They present a user-friendly and cost-effective means for the average investor to participate in the digital asset realm.

Unlike the traditional method of direct cryptocurrency investment, which can be complex and intimidating, Bitcoin ETFs provide a structured and approachable entry point.

Mainstream Legitimacy

The impending approval of Bitcoin ETFs heralds a new era of legitimacy for cryptocurrencies. These ETFs bridge the gap between traditional financial markets and the crypto space, bringing credibility to the forefront. With the backing of mainstream financial institutions, Bitcoin’s status as a viable investment asset is reinforced.


The Ripple Effect

Broad Market Growth for Bitcoin

The surge in Bitcoin’s price triggered a ripple effect throughout the cryptocurrency market. The CoinDesk Market Index (CMI), tracking various tokens, recorded an impressive 22% growth during October. This upswing signifies a prevailing bullish sentiment, injecting confidence into the crypto landscape.

Bitcoin Market Capitalization Soars

TradingView data reveals that the total market capitalization of all cryptocurrencies soared by nearly 19%, reaching a substantial $1.255 trillion. This surge represents the most significant increase in crypto wealth since January, underlining the market’s resilience and growth potential.

Bitcoin/US Dollart One-month Chart By Ultima Markets MT4

(BTCUSD One-month Chart)


Bitcoin’s Outstanding Performance

Bitcoin’s Ascendancy

Bitcoin (BTC), the pioneer of cryptocurrencies, outperformed its peers during this remarkable rally. BTC advanced by more than 27%, achieving a 17-month high of $35,000. This surge followed a period during which it traded around $27,000 in the early weeks of October. Currently, Bitcoin maintains its position above $34,000, as investors eagerly await the Federal Reserve’s interest rate decision.

Confidence in Bitcoin

Bitcoin’s impressive performance during this surge underscores its appeal to investors worldwide. Its stability above $34,000 signals growing confidence in Bitcoin as a long-term store of value and investment asset.


Conclusion

The surge of Bitcoin in October 2023 was nothing short of phenomenal, fueled by the prospects of Bitcoin ETF approval in the United States. This surge not only transformed Bitcoin but had a cascading effect on the broader cryptocurrency market. It showcased resilience, promise, and Bitcoin’s enduring position as a prominent player in the digital asset landscape.

The cryptocurrency market is still changing as time goes on. The forthcoming introduction of Bitcoin ETFs into traditional financial markets marks a significant turning point, providing investors of all stripes with accessibility, legitimacy, and a wide range of investment options.


Focus on EUR/USD Today – 1st November 2023 


Comprehensive EUR/USD for November 1, 2023

In this comprehensive analysis, Ultima Markets brings you an insightful breakdown of the EUR/USD for 1st November 2023. 


Key Takeaways 

  • ECB monetary policy: The latest interest rate decision of the European Central Bank has chosen to suspend interest rate hikes, it is the first time since July 2022.  As expectations for the suspension of interest rate hikes have been generally reflected in the markets, short-term volatility in Europe and the United States will be modest.
  • Economic outlook for the Eurozone: The manufacturing industry in the Eurozone continues to decline, the service industry is weak, demand is sluggish, and the economy may remain fragile in the coming months. 
  • The US dollar may be strong: The market is betting that the interest rate decision announced by the Federal Reserve early Thursday may not raise interest rates, but may maintain hawkish rhetoric. The yield of two-year US bonds, which are more sensitive to monetary policy, rose to 5.08% 

EUR/USD Technical Analysis 


EUR/USD Daily Chart Insights

EUR/USD Daily Chart Insights By Ultima Markets MT4
  • Stochastic Oscillator: The indicator’s fast line and slow line were entangled yesterday, and the market entered a oscillating rhythm again. Wait for the indicator to show long or short signals. 
  • Price Action: After the exchange rate returns to the moving average, a pin bar appears, indicating that short sellers have the upper hand, but short sellers still need to wait for the market to fall below the previous low price of 1.0520. 
  • Flag-shaped consolidation structure: The exchange rate has fluctuated upward since October 4, and the overall price has shown a flag-shaped shock range. The 65 moving average successfully suppressed the further rebound of the exchange rate. Next, we will pay attention to whether today’s market can fall below the range. If the range is still effectively supported, the market will rebound and rise again. Otherwise, short opportunities will come. 

EUR/USD 1-hour Chart Analysis

EUR/USD 1-hour Chart Analysis By Ultima Markets MT4
  • Stochastic Oscillator: The fast line is about to cross the slow line, suggesting that the exchange rate is about to fall into consolidation in the short term. 
  • Moving average combination: The exchange rate fell below the 200-period moving average. Currently, the 33-period moving average and the 65-period moving average have not yet crossed the 200-period moving average. Theoretically, when the fast line crosses the slow line, the market may return to the short-term moving average group. 

Ultima Markets MT4 Pivot Indicator

Ultima Markets MT4 Pivot Indicator for EUR/USD
  • According to the pivot indicator in Ultima Markets MT4, the central price of the day is established at 1.06023, 
  • Bullish Scenario: Bullish sentiment prevails above 1.06023, first target 1.06469, second target 1.07193; 
  • Bearish Outlook: In a bearish scenario below 1.06023, first target 1.05299, second target 1.04851. 

Conclusion