Comprehensive GBP/NZD for October 31, 2023
In this comprehensive analysis, Ultima Markets brings you an insightful breakdown of the GBP/NZD for 31st October 2023.
Key Takeaways
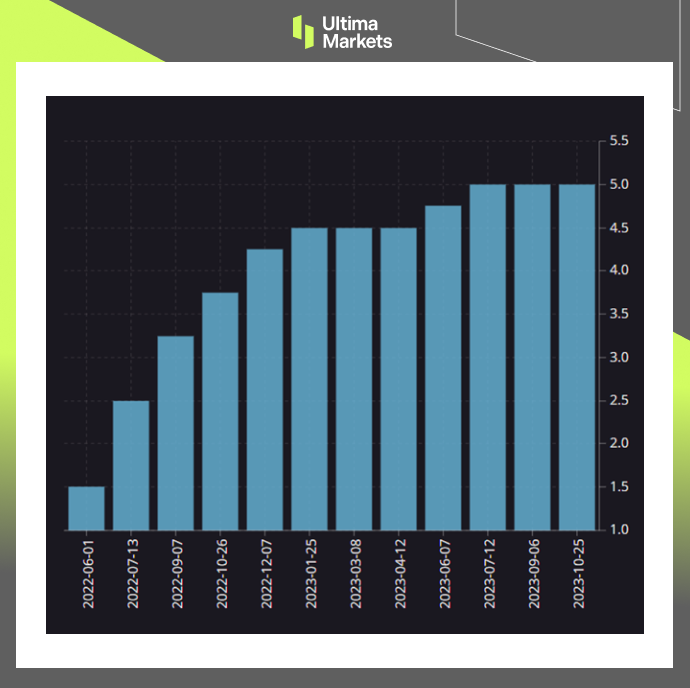
- BOE Monetary Policy: The Bank of England will announce its latest interest rate decision this Thursday. The current economy in the UK does not support another interest rate hike, and the market is paying attention to how the Bank of England views the future economy. If any dovish signal is released, the pound will have a huge depreciation trend.
- New Zealand Monetary Policy: Currently, New Zealand’s overall CPI is lower than the central bank’s expectations, and the market expects an interest rate hike from November this year to February next year. Any event that stimulates an interest rate hike this year will cause the New Zealand dollar to appreciate.
GBP/NZD Technical Analysis
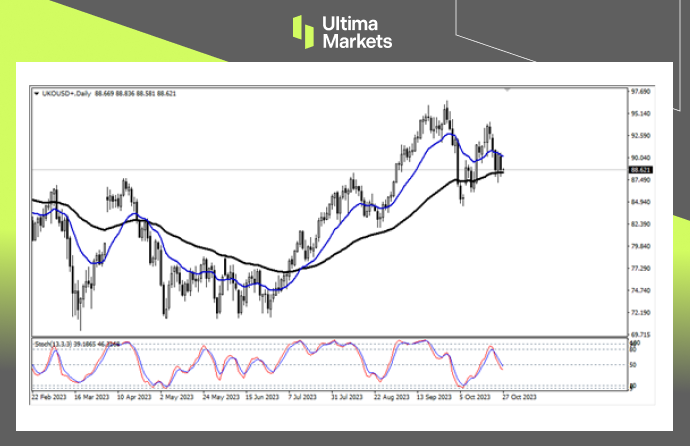
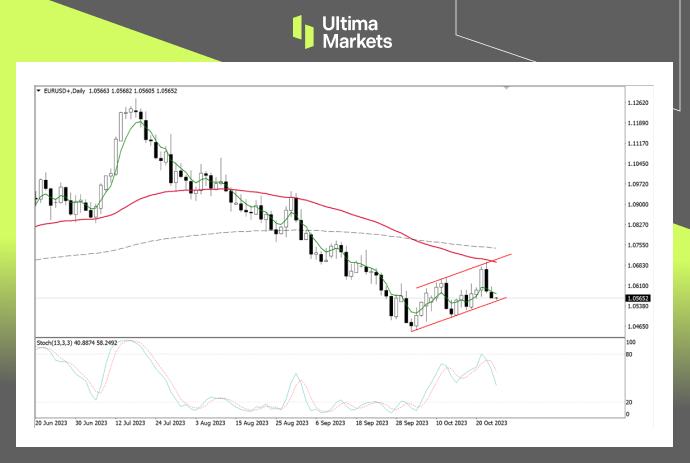
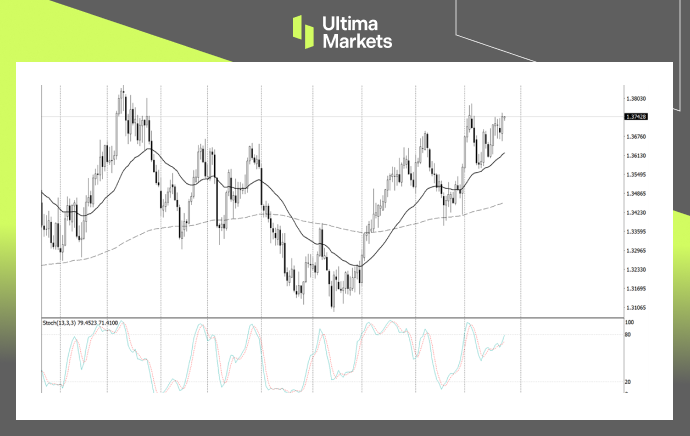
GBP/NZD Daily Chart Insights
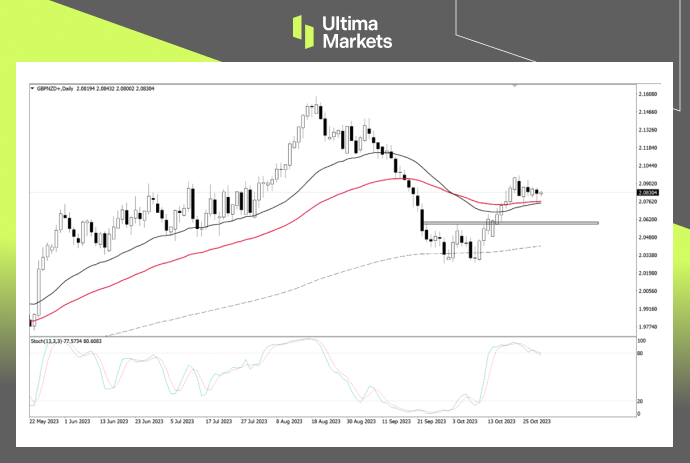
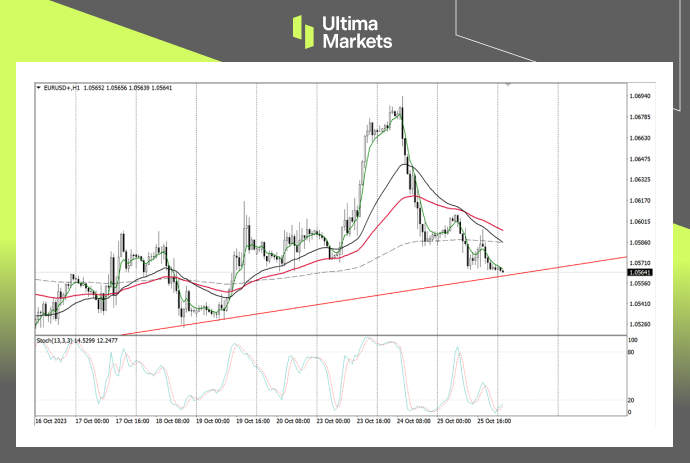
- Stochastic Oscillator: The indicator shows a short signal in the overbought area, suggesting that the market is about to fall into a correction, and may even reverse downward.
- Moving average combination: After the exchange rate broke through the 33-day moving average and the 65-day moving average , a retracement structure appeared, and it is currently consolidating sideways above the two moving averages. Coupled with the stochastic oscillator, there is a greater probability that the market will continue to rise after completing the consolidation.
- Price Action: After the exchange rate completed the W-bottom price action on October 13, the neckline position was an important support price. Although the market is currently consolidating above the moving average, it cannot be ruled out that the market will further fall back to the neckline price.
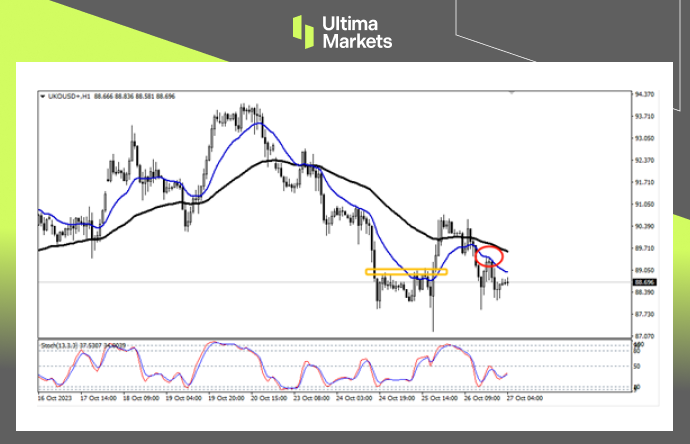
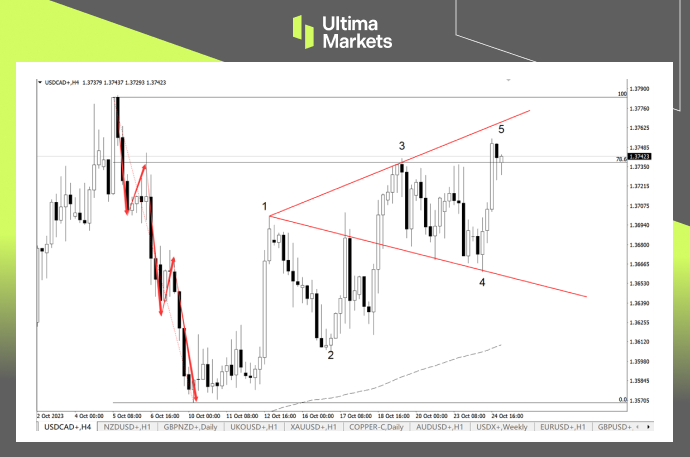
GBP/NZD 4-hour Chart Analysis
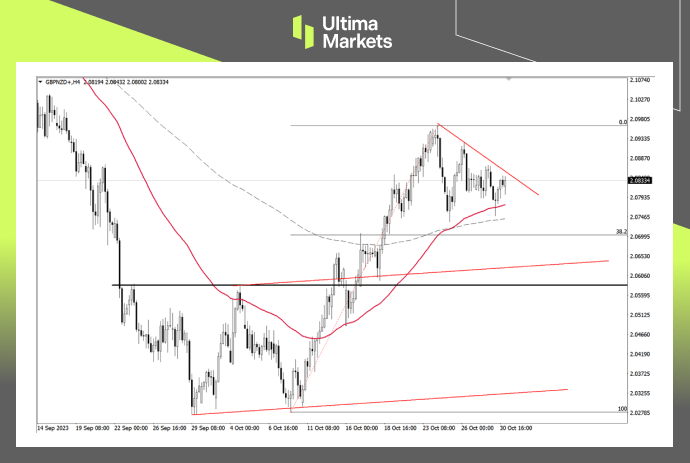
- Moving average combination: The exchange rate is supported by the 65-period moving average and the 200-period moving average, showing a convergent triangle structure in the short term.
- Fibonacci retracement level: If the moving average cannot continue to support the exchange rate, the next target will be the 38.2% Fibonacci retracement level.
- Channel line support position: The second target of the market correction is the upper edge of the upward channel below, which is a potential strong support price. If it returns into the channel again, the market will clearly reverse and move downward.
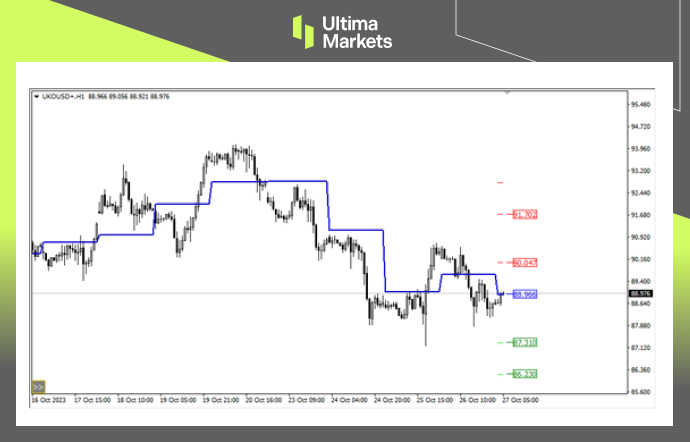
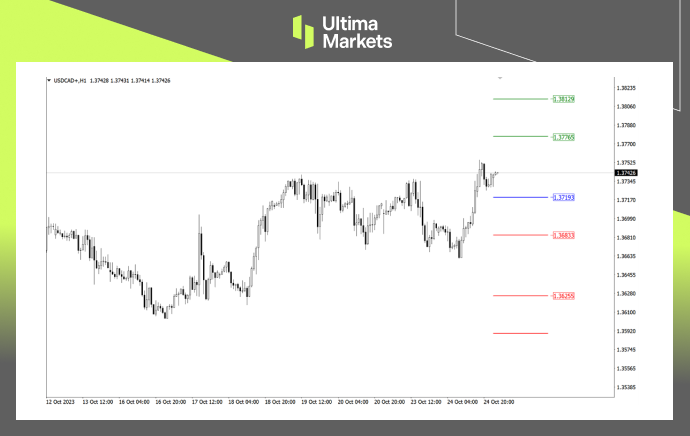
Ultima Markets MT4 Pivot Indicator
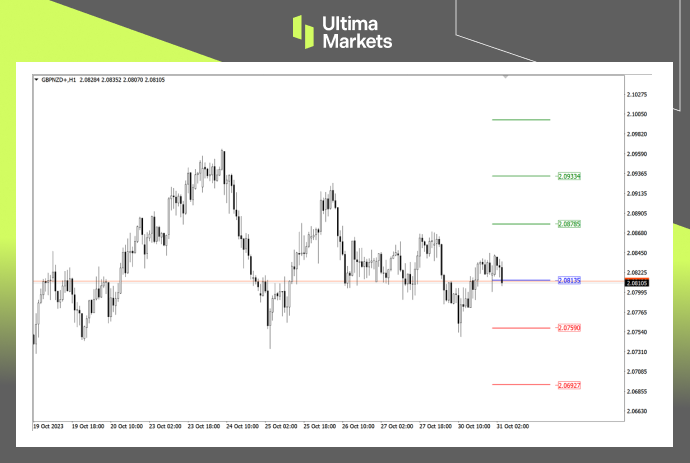
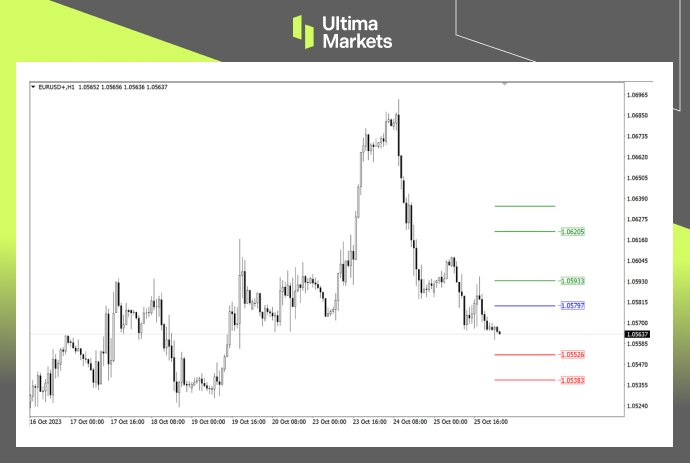
- According to the pivot indicator in Ultima Markets MT4, the central price of the day is established at 2.08135,
- Bullish Scenario: Bullish sentiment prevails above 2.08135, first target 2.08785, second target 2.09334;
- Bearish Outlook: In a bearish scenario below 2.08135, first target 2.07590, second target 2.06927.