Comprehensive GBP/USD for October 24, 2023
In this comprehensive analysis, Ultima Markets brings you an insightful breakdown of the GBP/USD for 20th October 2023.
Key Takeaways
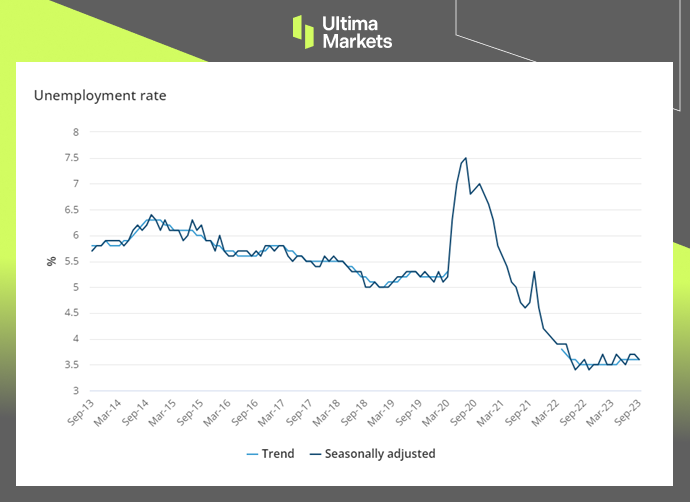
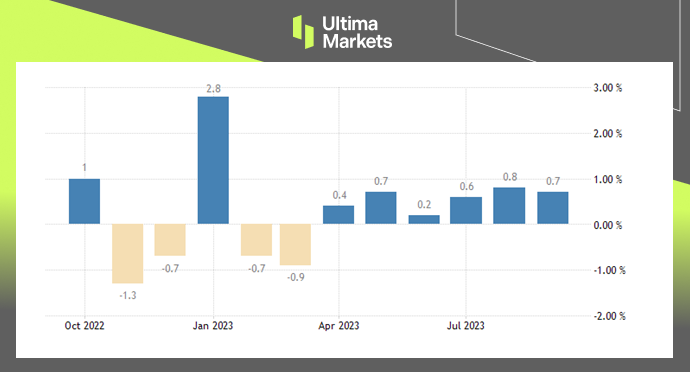
- Unemployment rate is the key: The British unemployment rate rose slightly in August, which means that the labor market continues to cool down, reducing inflation to a certain extent. If the unemployment rate continues to rise today, the pound may weaken and fall.
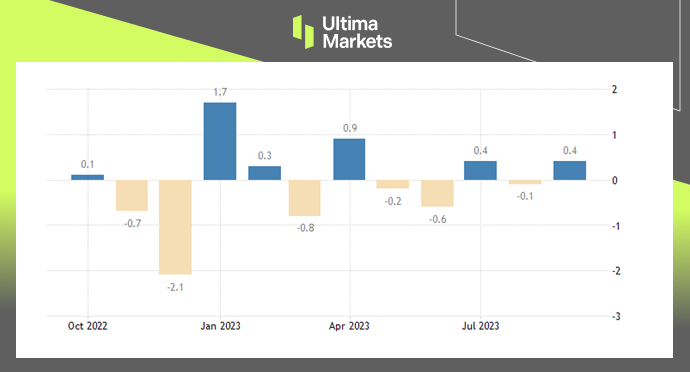
- Economic pressure in the UK: UK PMI data for October will be released this afternoon, which has always been below the 50 boom-bust line in the early stage. Last week’s UK retail sales data and inflation report both showed that economic activity is weakening, and today’s data may still be in the contraction range.
GBP/USD Technical Analysis
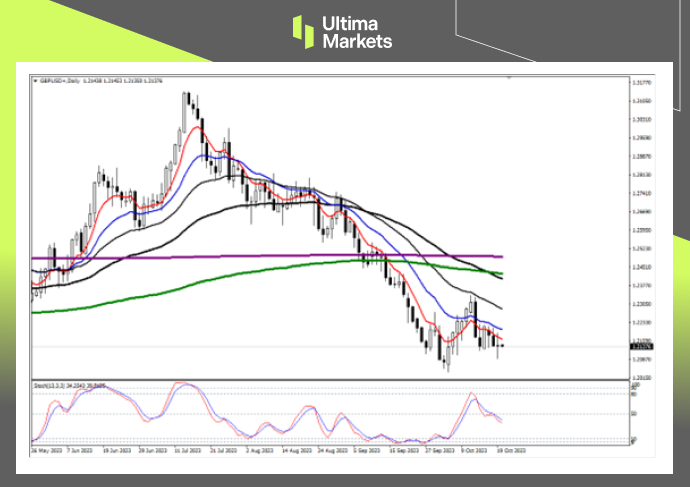
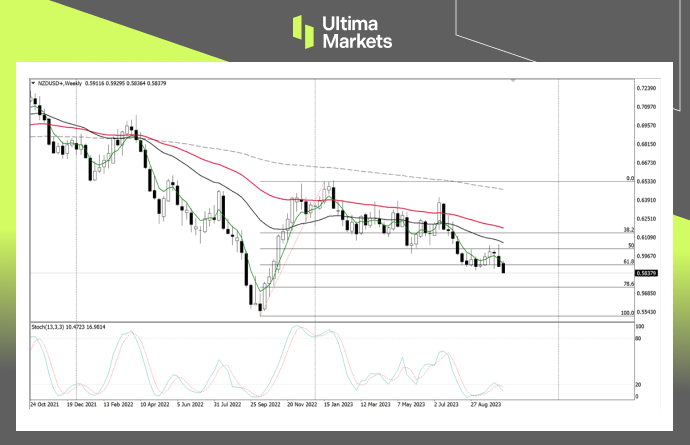
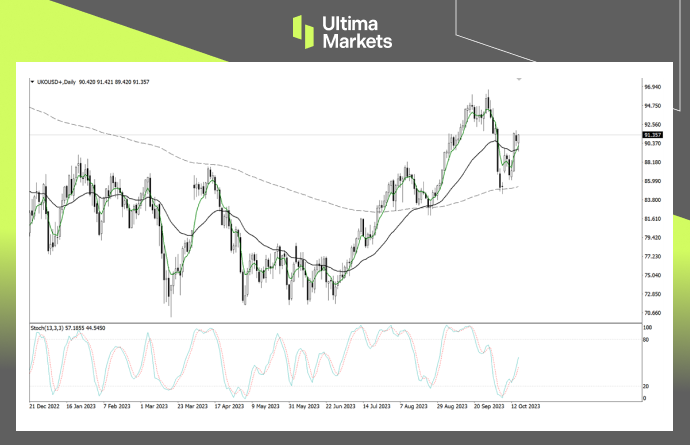
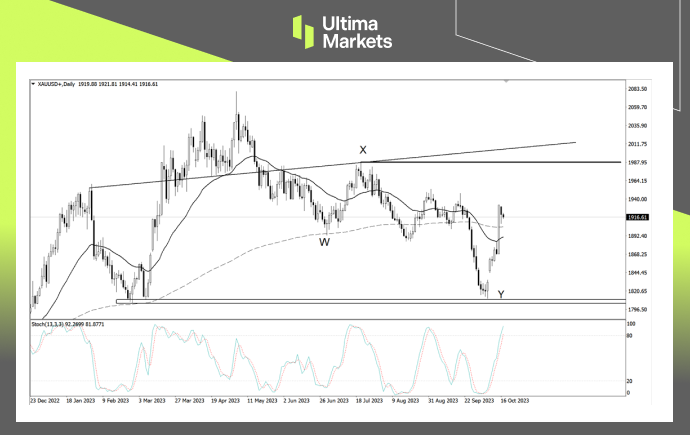
GBP/USD Daily Chart Insights
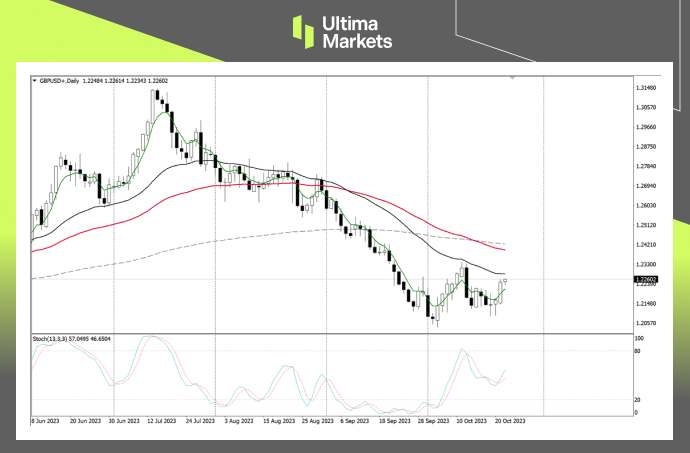
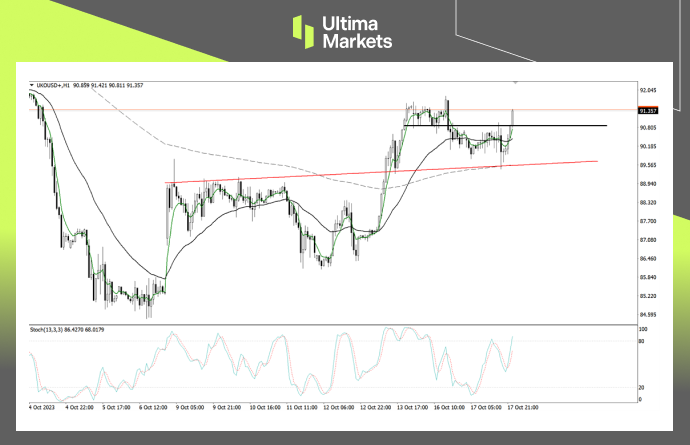
- Stochastic Oscillator: The indicator completed the “golden cross” structure again yesterday, and there is a certain probability that the short-term market will continue to rise.
- Price Action: Last week the bar came out of a bottom structure. In conjunction with the sharp rise yesterday, the bar has formed an evening star combination structure. The market has a probability of continuing to rise.
- Moving average resistance: The current exchange rate is below the 33-day moving average (black line). At the same time, the overall market price and short-term moving average are also below the 200-day moving average (dashed line). Even if it is now experiencing a short-term rise, it cannot be premature to conclude that the reversal of the pound is coming.
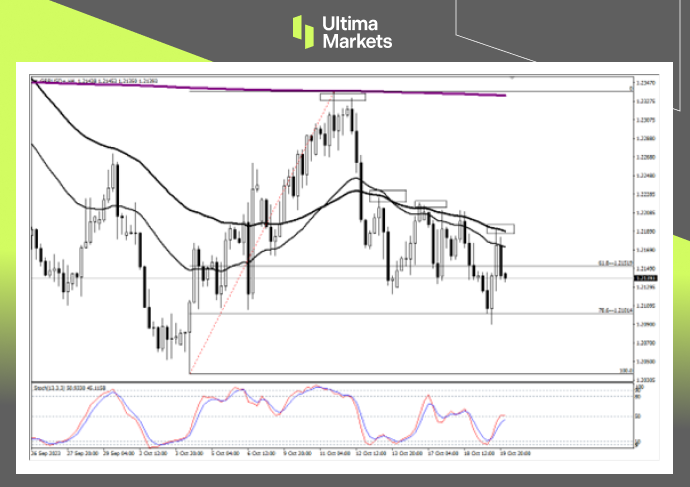
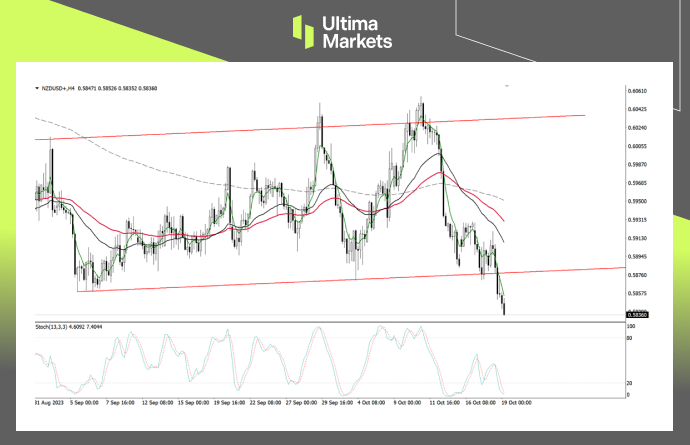
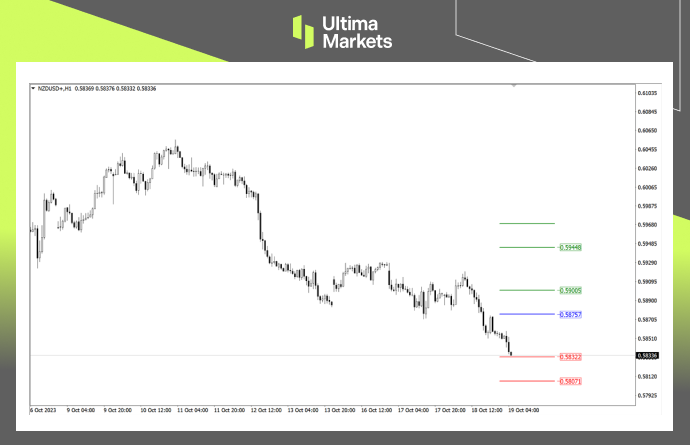
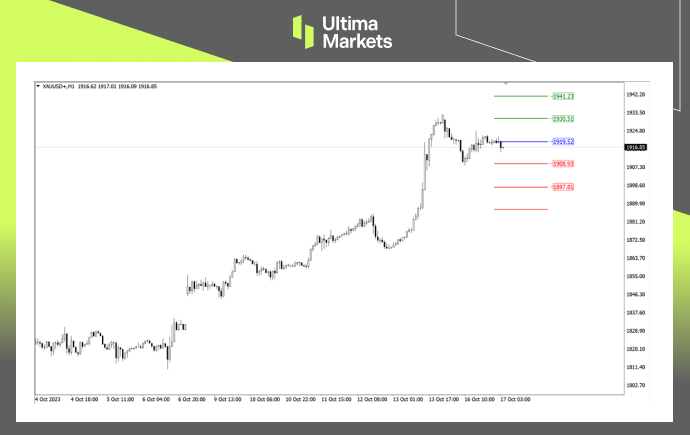
GBP/USD 1-hour Chart Analysis
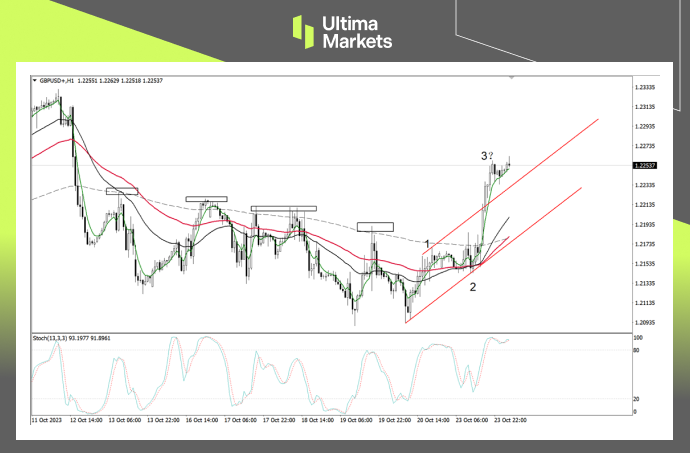
- Stochastic oscillator: The indicator is entangled in the overbought area. Currently, bulls in the market have the upper hand, and there is some correction pressure on the short-term exchange rate.
- Price action: In the end, the market price broke through the previous lowering highs, the overall downward structure was destroyed, and the intraday market ushered in a reversal. If you want to enter the market with the trend, you need to wait for the retracement structure to appear.
- Elliot wave structure: After the market price quickly broke through the upward channel line yesterday, it can be temporarily judged that driving wave 3 is underway. The support position is the upper edge of the upward channel. After the market falls back, you can look for trading opportunities.
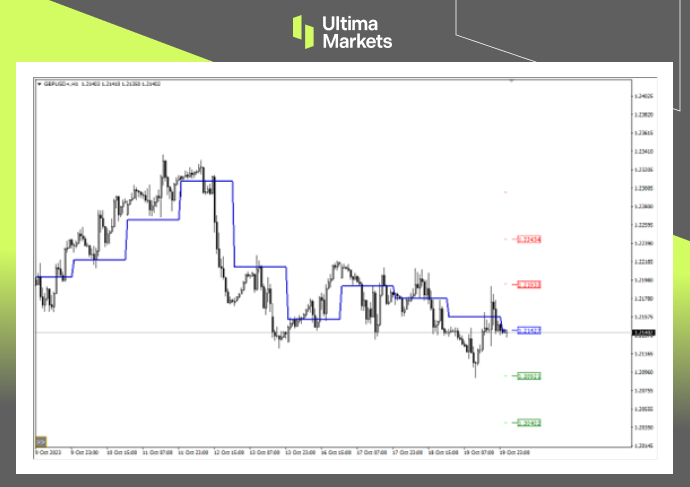
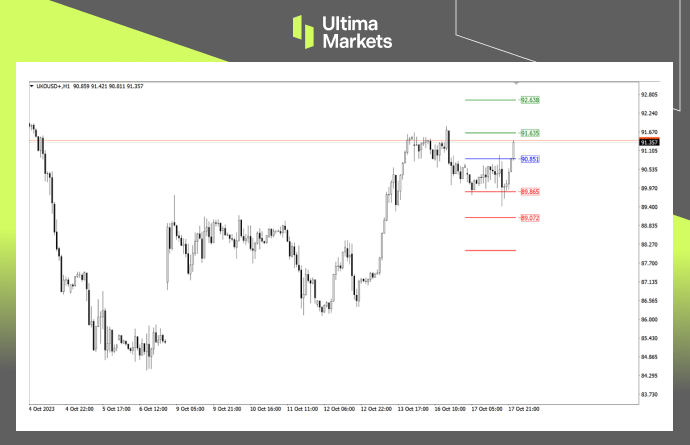
Ultima Markets MT4 Pivot Indicator
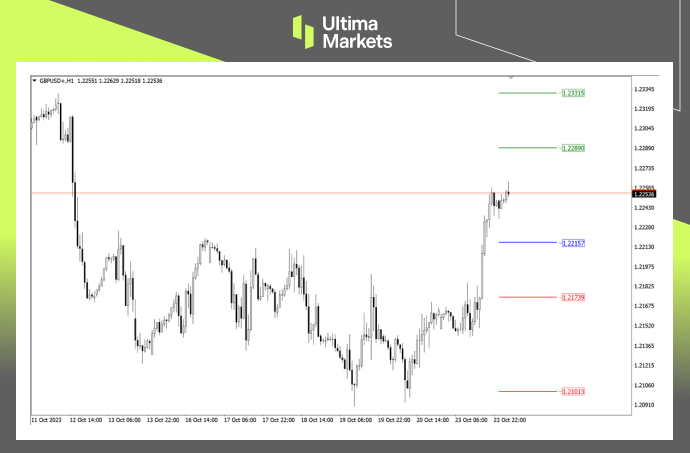
- According to the pivot indicator in Ultima Markets MT4, the central price of the day is established at 1.22157,
- Bullish Scenario: Bullish sentiment prevails above 1.22157, first target 1.22890, second target 1.23315;
- Bearish Outlook: In a bearish scenario below 1.22157, first target 1.21739, second target 1.21013.