In this comprehensive analysis, Ultima Markets brings you an insightful breakdown of the AUDUSD for 15th November 2023.
Key Takeaways
CPI hits the dollar: U.S. October CPI and core CPI data were both lower than expected, and interest rate futures price the Fed’s current interest rate hike cycle to a complete end
The Fed’s interest rate cut cycle is coming: The overall interest rate hike cycle is expected to end, leading the market to begin to expect a cumulative 100 basis points interest rate cut by the end of next year, with the first round of interest rate cuts as early as May. These have put extreme pressure on the dollar to sell off.
Technical Analysis
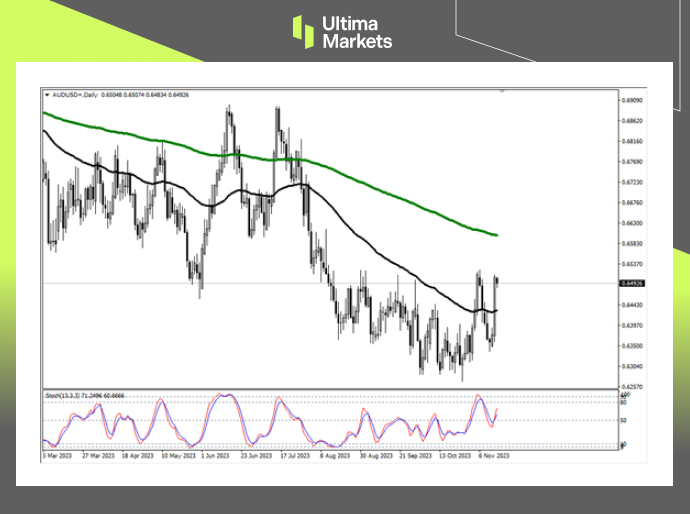
Daily Chart Insights
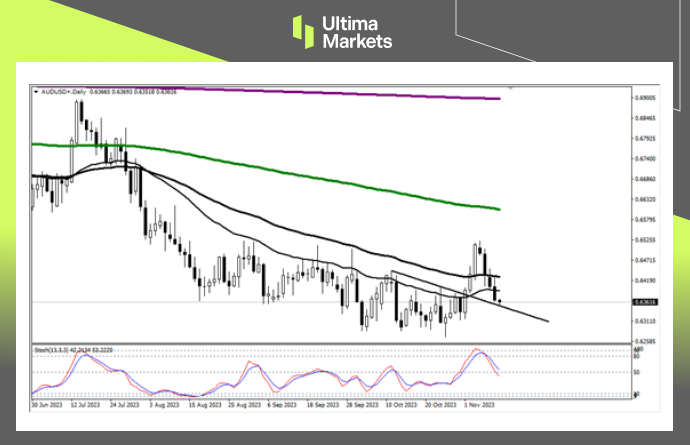
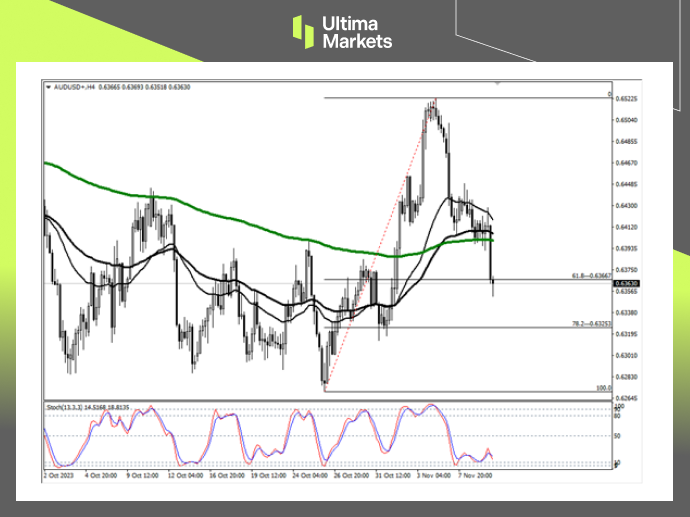
Stochastic Oscillator: The indicator sent a bull signal above the 50 midline yesterday, suggesting that the exchange rate will start a strong upward trend.
65-day moving average: The exchange rate strongly exceeded the 65-day moving average yesterday, and the resistance line converted into a support line. The probability of the Australian dollar continuing to depreciate is low.
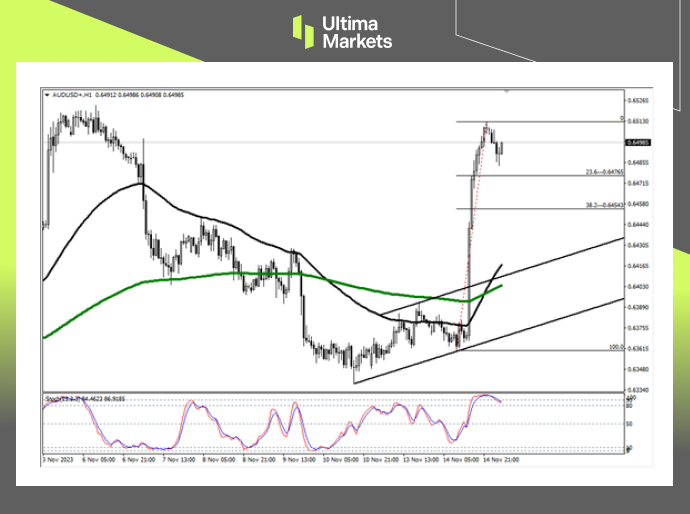
1-hour Chart Analysis
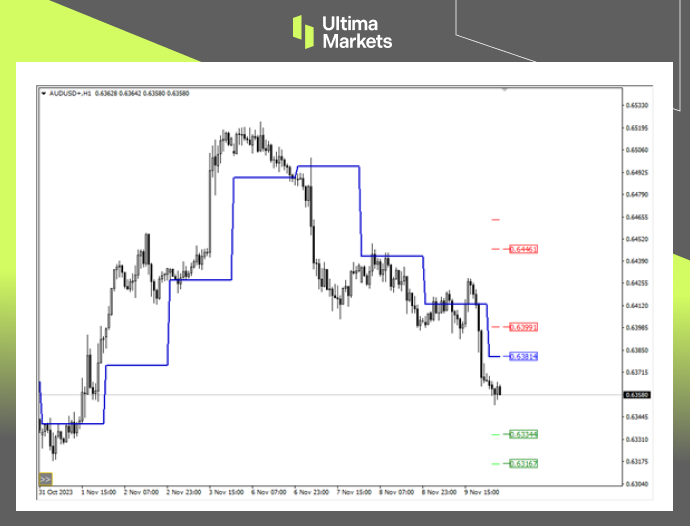
Stochastic oscillator: The indicator enters the overbought area to form a short signal, suggesting that the subsequent market will enter a correction. Traders should not rush to enter the market chasing high prices, as the profit-loss ratio is inappropriate.
Fibonacci retracement levels: In a rapidly rising market, the correction usually looks towards the 23.6% and 38.2% Fibonacci retracement levels.
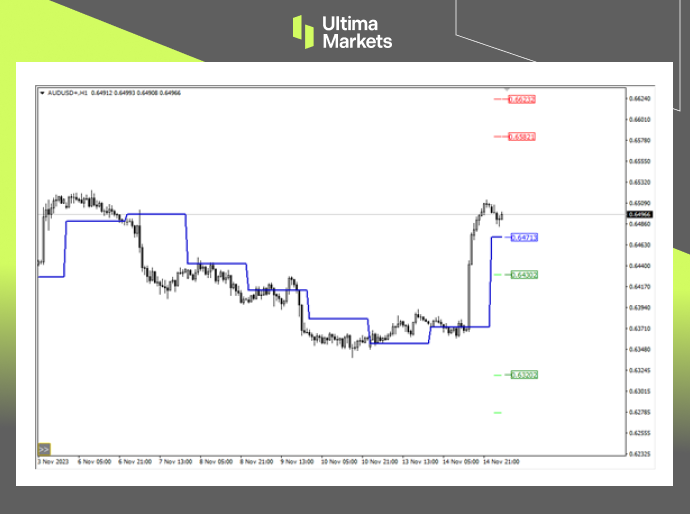
Pivot Indicator
According to the pivot indicator in Ultima Markets MT4, the central price of the day is established at 0.64713,
Bullish Scenario: Bullish sentiment prevails above 0.64713, first target 0.65821, second target 0.66232;
Bearish Outlook: In a bearish scenario below0.64713, first target 0.64302, second target 0.63202.
Conclusion
To navigate the complex world of trading successfully, it’s imperative to stay informed and make data-driven decisions. Ultima Markets remains dedicated to providing you with valuable insights to empower your financial journey.
For personalized guidance tailored to your specific financial situation, please do not hesitate to contact Ultima Markets.
Join Ultima Markets today and access a comprehensive trading ecosystem equipped with the tools and knowledge needed to thrive in the financial markets.
Stay tuned for more updates and analyses from our team of experts at Ultima Markets.
—–
Legal Documents
Ultima Markets, a trading name of Ultima Markets Ltd, is authorized and regulated by the Financial Services Commission “FSC” of Mauritius as an Investment Dealer (Full-Service Dealer, excluding Underwriting) (license No. GB 23201593). The registered office address: 2nd Floor, The Catalyst, 40 Silicon Avenue, Ebene Cybercity, 72201, Mauritius.
Comments, news, research, analysis, price, and all information contained in the article only serve as general information for readers and do not suggest any advice. Ultima Markets has taken reasonable measures to provide up-to-date information, but cannot guarantee accuracy, and may modify without notice. Ultima Markets will not be responsible for any loss incurred due to the application of the information provided.
Written on November 15, 2023 at 12:57 pm, by mervin
Comments Off on Focus on AUDUSD today – 15th November 2023
China Expected to Lift Procurement Ban during APEC
On Nov. 13th, the Dubai Airshow commenced, and Boeing (BA.US), the jet manufacturer of Dow Jones, has already successfully secured a series of significant orders. Emirates has agreed to acquire 90 Boeing 777 aircraft, which are valued at an impressive $52 billion. Additionally, Emirates’ sister airline, Flydubai, will be incorporating 30 Boeing 787 Dreamliners into its fleet through an $11 billion agreement. This significant deal arrives at a time when Emirates is looking to enhance its aircraft portfolio.
Separately, SunExpress, a joint venture between Turkish Airlines and Lufthansa, also announced a major order for Boeing 737 aircraft. The deal includes an order for 28 737-8 models and 17 737-10 models, with the option to purchase up to 45 additional 737 MAX planes. SunExpress has previously placed an order for 42 737-8 aircraft, of which nine have already been delivered. Furthermore, Ethiopian Airlines finally announced that it has decided to resume flying the 737 MAX after the 2019 crash incident. Ethiopian Airlines revealed on Tuesday that it has agreed to a deal with Boeing for the purchase of 20 737 MAX planes and 11 more 787 Dreamliners. Boeing stated that the sale was the largest-ever purchase of its airplanes in African history, however, declined to disclose the value of the deal.
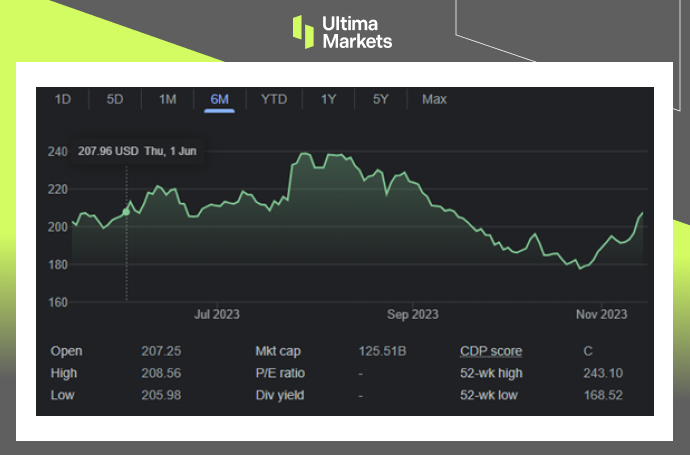
According to reports, China is considering lifting a sales freeze on Boeing 737 Max jets, potentially paving the way for the planemaker to resume sales in the country. The news comes as President Biden and President Xi are set to meet at the APEC conference in San Francisco, raising the possibility that the sales freeze could be lifted in conjunction with the meeting. While China is reportedly considering a commitment to purchase 737 jets, discussions are still underway and President Xi is not expected to announce a formal order. If this move comes to fruition, it would be a major development for Boeing, which hasn’t made significant sales in China since 2018 following the grounding of the 737 Max after two crashes. After receiving a string of positive updates, Boeing experienced two consecutive days of trading gains.
(Boeing Stock Performance Six-month Chart)
Disclaimer
Comments, news, research, analysis, price, and all information contained in the article only serve as general information for readers and do not suggest any advice. Ultima Markets has taken reasonable measures to provide up-to-date information, but cannot guarantee accuracy, and may modify without notice. Ultima Markets will not be responsible for any loss incurred due to the application of the information provided.
Written on November 15, 2023 at 11:38 am, by mervin
Comments Off on Boeing Bottoms Out on Fruitful Gains at Airshow
In this comprehensive analysis, Ultima Markets brings you an insightful breakdown of the USD/JPY for 14th November 2023.
Key Takeaways
The widening interest rate gap is the fundamental factor: On October 31, the Bank of Japan further relaxed its control on government bond yields, while the Federal Reserve still has the possibility of raising interest rates. The policy interest rate gap between the two continues to widen, causing the Japanese yen to fall into a continued depreciation trend.
Carry trade is a booster: The interest rate differential between the two countries and the recent continued low volatility of the yen also encourage carry trade. It is a strategy of selling low-interest Japanese yen funds in exchange for high-yielding currencies. This is a contributing factor that keeps the yen under pressure.
The Japanese yen unexpectedly surged: The Japanese yen unexpectedly surged during the U.S. trading session yesterday, which once made the market think that the Bank of Japan had intervened. However, according to the current news, it may be an appreciation fluctuation caused by the adjustment of Japanese yen options positions. Previously, when asked whether he was prepared to intervene in the foreign exchange market or take other measures to curb the yen’s decline, Japan’s top monetary official Masato Kanda said that the authorities “are on standby.”
Frightened Japanese Yen: If the U.S. economic data released this week is good, the Fed’s suspense about raising interest rates will remain. This could push USD/JPY towards the 152 range. However, the continued depreciation of the yen will make the market continue to be wary of the intervention of the Bank of Japan. Once there are signs of appreciation of the yen, the withdrawal of profit-making positions and traders preparing to go long yen on the sidelines will cause the dollar to experience a rapid downward trend against the yen.
USD/JPY Technical Analysis
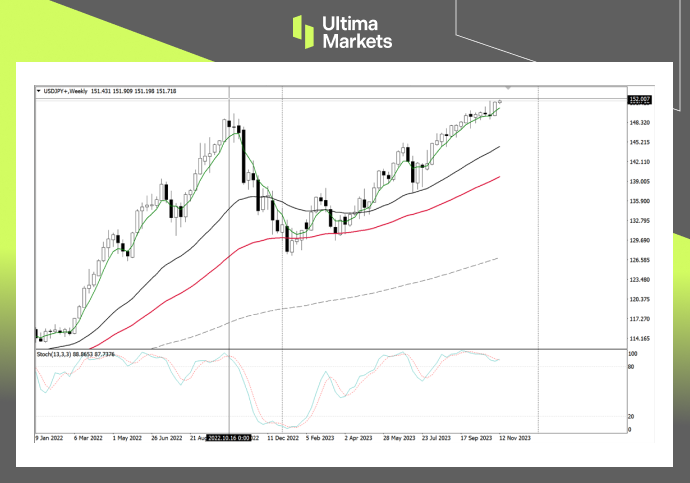
USD/JPY Weekly Chart Insights
Stochastic Oscillator: The indicator has already showed a short signal in early October, but the current market price and the indicator continue to deviate. This implies that the current upward trend is very fragile. Even if it breaks through the high point of October last year again, it cannot be judged as bullish.
5-week moving average: Since August this year, the overall upward trend of the US dollar against the yen has always been supported by the 5-week moving average. If the 5-week moving average cannot support the overall upward trend, the market’s downward trend could be established.
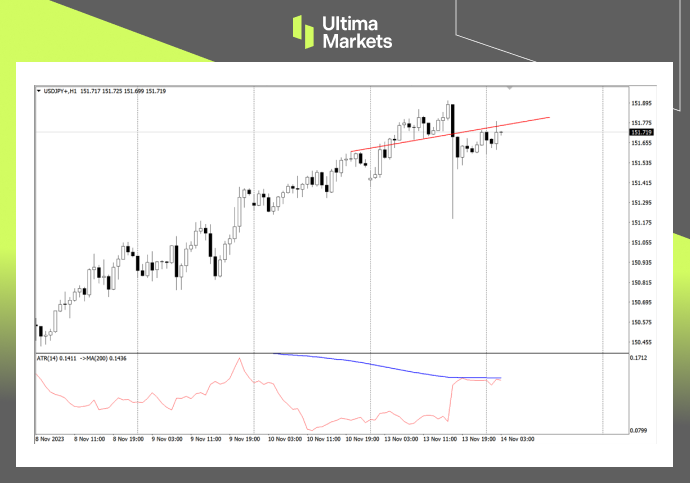
USD/JPY 1-hour Chart Analysis
ATR combination indicator: The volatility suddenly rose yesterday, but it still did not break through the average volatility of the past 200 hours. This implies that yesterday’s rapid decline was not an effective breakthrough, and there is still a possibility that the market will continue to rise.
Neckline: The rapid decline in the market fell below the neckline support level, and then the market price slowly rose. It is now back to test the neckline price. If it continues to rise, the top structure will be effective, and the market will continue to hit highs.
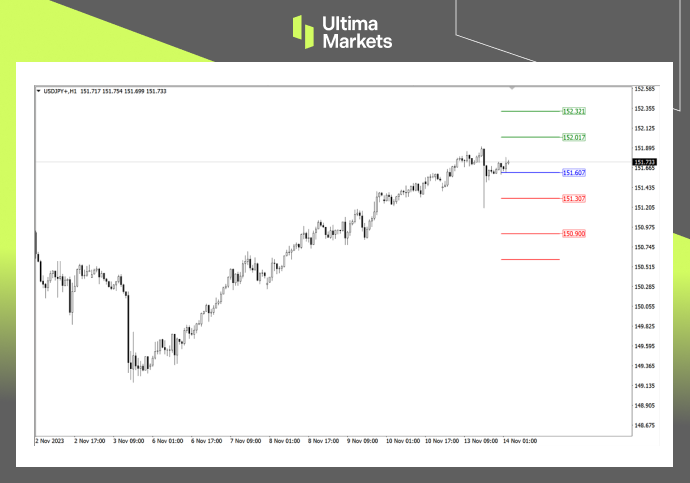
Ultima Markets MT4 Pivot Indicator
According to the pivot indicator in Ultima Markets MT4, the central price of the day is established at 151.607,
Bullish Scenario: Bullish sentiment prevails above 151.607, first target 152.017, second target 152.321;
Bearish Outlook: In a bearish scenario below 151.607, first target 151.307, second target 150.900.
Conclusion
Written on November 14, 2023 at 11:14 am, by mervin
Comments Off on Focus on USD/JPY Today – 14th November 2023
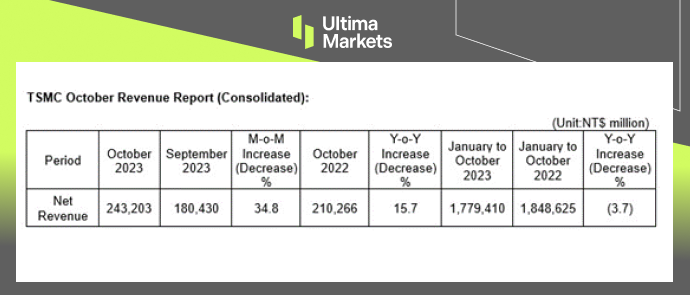
On November 10, Taiwan Semiconductor Manufacturing Company (TSM.US) announced that its October revenue was a record-breaking US$7.53 billion (NT$243.2 billion), representing a notable 34.8% increase from September and a 15.7% raise from the same period last year.
(TSMC Consolidated October Revenue)
Unveiling the TSM’s Revenue Numbers
TSMC’s cumulative revenue for the first 10 months of 2023 stood at an impressive US$55.6 billion, showcasing a modest 3.7% decline from the corresponding period in 2022.
The company’s resilience in navigating the challenges posed by weaker global demand in certain sectors, particularly consumer electronics, is evident in these numbers.
The surge in demand for TSMC’s cutting-edge 3nm technology played a pivotal role in its ADR surging more than 6% following the earnings release.
TSM’s Leadership Insight
C. C. Wei, TSMC’s CEO, expressed unwavering optimism regarding the chip market during a recent statement. He anticipates that the company will soon overcome the challenges of a prolonged sluggishness, primarily attributed to the lingering effects of the COVID-19 pandemic.
The surge in the AI industry, driven by an increased need for chips used in training large language models, has significantly contributed to TSMC’s positive outlook.
TSM’s Technological Prowess
TSMC’s third-quarter revenue surge was underpinned by its advanced technology, with the 3nm, 5nm, and 7nm processes collectively accounting for an impressive 59% of the company’s total revenue.
Looking ahead, TSMC is set to push the boundaries further by mass-producing an even more advanced 2nm process in 2025. This ambitious move is poised to solidify TSMC’s position as a trailblazer in high-end technology development.
TSM’s Future Projections
As we look toward the future, TSMC’s fourth-quarter revenue for 2023 is anticipated to range between US$18.8 billion and US$19.6 billion, with an estimated midpoint of US$19.2 billion (approximately NT$614.4 billion at the current exchange rate of NT$32 per US$1).
This represents an impressive approximately 11.1% increase on a quarterly basis. Despite the expectation of a slight dip in revenue in November and December compared to the stellar October figures, TSMC remains confident in achieving its financial forecast target.
The company estimates that the revenue in the remaining two months will average around US$5.84 billion.
Bottom Line
In conclusion, TSMC’s stellar performance in October is a testament to its resilience, technological prowess, and strategic vision.
The company’s commitment to advancing semiconductor technology, coupled with its optimistic outlook despite global challenges, positions TSMC as a formidable leader in the high-end technology landscape.
As TSMC continues to push the boundaries of innovation, the industry watches eagerly to witness the unfolding chapters of its success story.
Written on November 14, 2023 at 10:56 am, by mervin
Comments Off on TSM October Revenue Explode, Surpassing NT$15 Trillion Value
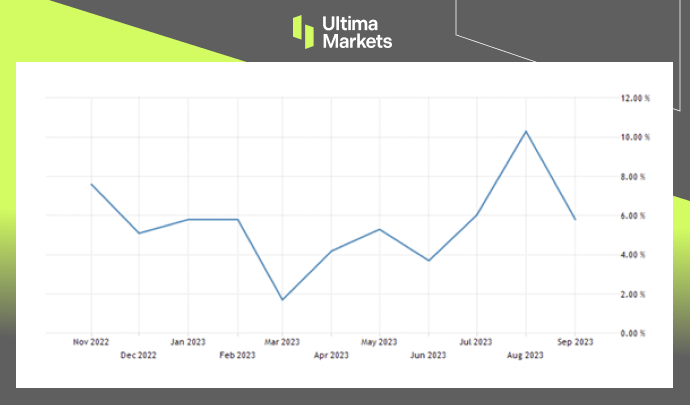
Industrial Growth in India Decelerated to 5.8% in September, Marking a Three-Month Low Compared to 10.3% in August
In the realm of economic fluctuations, India stands as a significant player, showcasing its industrial prowess amidst a landscape shaped by various factors.
Recent statistical revelations have illuminated the nuances of the country’s industrial growth, marking a shift in trajectory.
This marked a notable decline from the robust 10.3% witnessed in the preceding month of August, signifying a trend change.
This deceleration primarily found its roots in the manufacturing sector, a pivotal pillar in India’s industrial landscape.
(India Industrial Production, MOSPI)
Manufacturing Sector: A Key Player
The heartbeat of India’s industrial landscape, the manufacturing sector, underwent a 4.5% increase in output in September 2023, showcasing a notable surge from the 2.0% growth reported in the same period last year.
However, August’s buoyant growth, boasting a 9.3% increase, contrasted starkly against September’s tempered surge, outlining a clear trajectory shift.
Dissecting Sectoral Performance
Delving deeper into the fabric of industrial domains, the mining and electricity sectors portrayed a story of their own. The mining sector witnessed a 11.5% year-on-year growth in September, a tad lower than the 12.3% observed in August.
Similarly, the growth in electricity output decelerated to 9.9% in September, down from the substantial 15.3% recorded in the preceding month.
Causal Threads: Festivals and Weather Conditions
The festive calendar, a celebrated facet of Indian culture, intertwined with adverse weather conditions, emerged as pivotal factors contributing to the substantial easing observed across sectors.
These elements, intrinsic to the social and climatic fabric of the nation, influenced the industrial output significantly.
Currency Dynamics: The Tale of the Indian Rupee
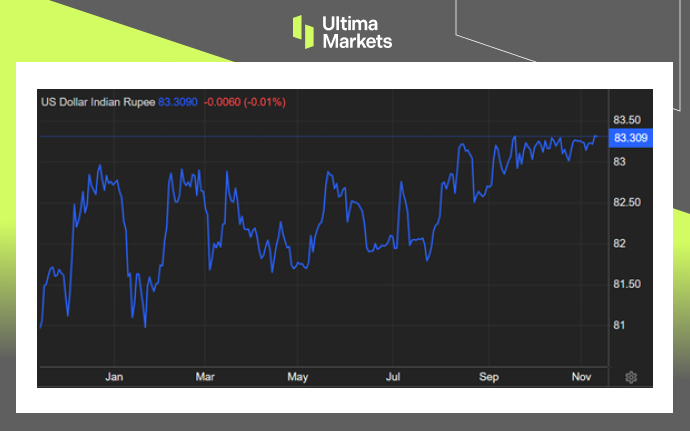
Simultaneously, the Indian rupee experienced a fluctuating trajectory, edging closer to a record low against the USD.
Sustained capital outflows from the Indian economy contributed to this, prompting the Indian rupee to depreciate beyond 83 per USD in November.
The Reserve Bank of India’s proactive stance, selling foreign exchange reserves to prevent further devaluation, played a pivotal role in maintaining a delicate balance.
(USD/INR 1-year Chart)
The Reserve Bank’s Role: A Balancing Act
The RBI’s consistent sale of foreign exchange reserves, totaling over $23 billion in the past four months, illustrates the active role played in stabilizing the Indian rupee’s value.
This strategic move has curbed excessive bearish positions on the currency, sustaining a delicate equilibrium amidst global economic ripples.
Navigating the Industrial Seas Ahead
As India charts its economic trajectory, acknowledging the impact of festivals, climatic variables, and global economic dynamics remains imperative. The interplay of these elements, intertwined with the resilience and adaptability of its industrial landscape, will shape the nation’s growth story.
In conclusion, India’s industrial growth paints a narrative of resilience amidst evolving circumstances, embodying a blend of challenges and strategic maneuvering to maintain equilibrium and foster sustainable growth.
Written on November 13, 2023 at 11:46 am, by mervin
Comments Off on Understanding India’s Industrial Growth Dynamics
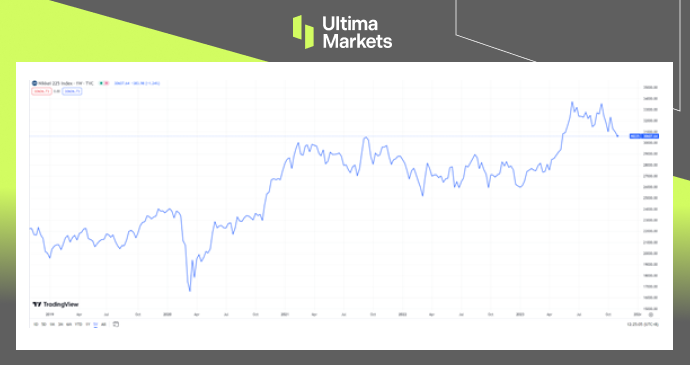
When it comes to the Japanese economy, that clichéd comment always pops up in our mind: “The Lost Decades.” Since the collapse of the bubble economy in the 1980s and 1990s, the Nikkei 225 Index has been sluggish. Especially when the COVID-19 epidemic broke out a few years ago, the Index once fell to a low of more than 16,000. Everything seems to indicate that the “lost decades” of Japan’s economy will continue.
The Nikkei 225 index, however, defied all logic by making a turnaround just after it hit bottom at the beginning of the recession. This year, on 19th of May, the Nikkei 225 index went beyond 30,800 points, achieving its highest level since 1990. That said, the Japanese stock market has kept rising ever since. It was as high as 33,000 just in June, beating most stock markets throughout the globe.
Why has the Japanese stock market, which has been in the doldrums for many years, been able to come back to life and continue to rise this year? After this round of surge, can the Nikkei 225 Index further continue its rise in the future? This article will take you to find out.
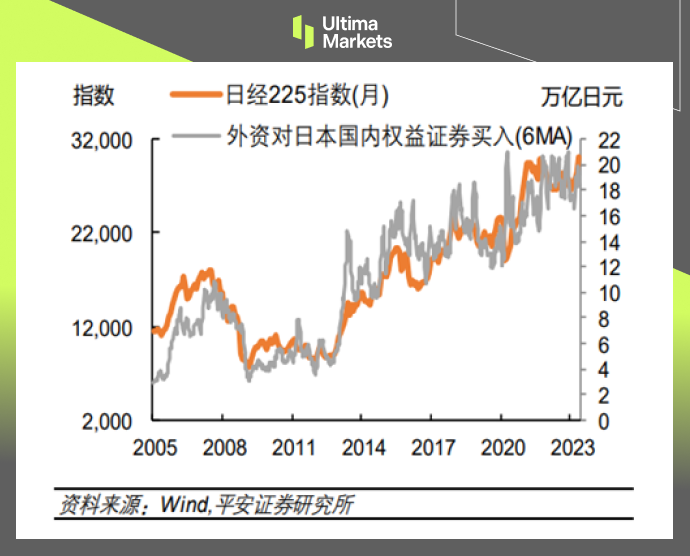
The performance of the Nikkei 225 Index in the past 5 years
The low financing cost of Japanese Yen
The exchange rate is usually crucial to a country’s stock market. For many non-U.S. currencies, once the domestic currency exchange rates against the U.S. dollar rise, the stock market prices will rise accordingly. China’s A-shares are a typical example. Once the RMB exchange rate against the U.S. dollar rises, the performance of A-share market will tend to start an upward trend. But Japan’s stock market is exactly a counterexample. In the past five years (as of the time of writing), the exchange rate of the Japanese yen against the US dollar has fallen by approximately 23.75%, but the Nikkei 225 index has increased by approximately 38%, obviously showing a negative correlation.
The reasons for this phenomenon mainly lie in two aspects:
Extremely low financing cost of Japanese Yen
Continuous inflow of foreign capital into Japan’s stock market
Since it is widely known that, following Japan’s economic bubble burst some thirty years ago, the BoJ has been engaged with slack monetary policies for quite some time in an endeavor at reviving market sentiment. It is clear that for so many years the Bank of Japan’s efforts to rehabilitate the market have gone unnoticed. However, those efforts helped to maintain Japan’s incredibly low-interest rates and finance costs. By lowering interest rates and purchasing government bonds, the Bank of Japan has effectively kept funding costs down. This means that businesses and investors can obtain funds at a lower cost, stimulating investment activity and increasing market liquidity. Low financing costs also provide companies with more room for capital returns, thus creating a basis for stock market gains.
Yet, it is no hidden secret that the Japanese yen has a very low cost of financing. This rate has been relatively low over multiple decades. So, the low financing rate by itself is definitely insufficient to justify the reason why the Nikkei 225 Index has shot up in the past few years. This leads to the second reason: the inflow of foreign capital.
Foreign capital accounts for more than half of the trading volume in the Japanese stock market, and the flow of foreign capital has an important impact on the Japanese stock market. The internationalization of Japan’s securities market started early: Since the revision of the Foreign Exchange Law in 1980, Japan has relaxed restrictions on bond investment by non-residents; in 1989, foreign capital was allowed to set up funds for investment; in 1992, the threshold was significantly lowered further, which greatly facilitated foreign investment. Subsequently, the number and transaction volume of foreign investors continued to increase. As of 2021, the number of foreign investors in Japanese exchanges has risen to about 30%, and the trading volume of foreign investors has exceeded 60%. Since 2005, foreign investors’ purchases of Japanese domestic equity securities have shown obvious synchrony with the trend of the Nikkei 225 Index. This shows that the movement of foreign capital affects the performance of the Japanese stock market to a great extent.
The “Buffett Effect” boosts Japanese stock market valuations
The topic pertaining to foreign capital inflows should also not miss mentioning Buffett’s effect. Increasingly, foreign institutions that are associated with Buffet have improved their positions in Japan’s shares, which makes the Nikkei 225 Index grow. Already, in the opening years of the pandemic outbreak at this point (in 2020), Buffett had started buying equity shares in the country’s five leading exchange bodies. For example, during his speech in early May this year at a Berkshire Hathaway shareholder meeting, even Buffett declared these five companies to be “smart, big” and that they operate “intelligently”. Everyone knows that Buffet is a “value investor” and a long-time investor in stocks with low prices. Buffet’s value investing entails screening for highly profitable firms, reliable cash flows, solid profitability records as well as outstanding leadership. Today, though Buffet continues to put more of his investment into Japanese companies and he views this as among the markets with great prospects for investment ventures. No doubt, this has attracted more market attention and enhanced the trend in the Japanese equity market.
First of all, Buffett’s investment behavior is seen as an endorsement of Japanese companies to some extent. This will increase investors’ confidence in these Japanese-listed companies, thereby driving up stock prices.
Secondly, Buffett is led by long-term investment, and his investment behavior demonstrates his confidence in the long-term growth potential of the company. This long-term investment concept has a positive impact on encouraging investors to maintain a patient and persistent investment attitude. After seeing Buffett’s success in the Japanese market, investors also tend to adopt a longer-term investment strategy and hold stocks with more confidence, which in turn steadily promotes the rise of the stock market.
Can the Nikkei 225 Index continue its rise in the future?
Short-term funds may raise the trend for any country’s stock market in the short run, but the long-term success of a stock market depends on its fundamentals; therefore, the fundamentals of the Japanese stock market are no exception.
However, the Japanese economy has long faced a problem, that is, the existence of a large number of “zombie companies” that has hindered economic development. The so-called zombie companies refer to those companies that have stopped production, semi-stopped production, suffered losses for consecutive years, or are insolvent. They mainly rely on government subsidies and bank loan renewals to survive and operate. Since the Japanese economic bubble thirty years ago, the Bank of Japan has fueled bail-outs to a large number of companies in order to save the market, which has led to the existence of a large number of zombie companies.
On September 21 this year, Toshiba, a former symbol of Japan’s manufacturing industry and with a history of 150 years, was officially delisted. Many people believe that the collapse of Toshiba, a famous Japanese company, seems to mean that Japan’s manufacturing industry is losing its last fig leaf. But if we look at it from another perspective, we may have a completely different feeling.
Toshiba’s decline has actually been foreshadowed for a long time. As early as more than ten years ago, Toshiba’s operating income had been declining year by year. In this regard, Toshiba can only continue to “shut down departments” to survive. In 2015, Toshiba sold its image sensor business to Sony; in 2016, it sold its home appliance business to Midea; in 2017, it sold its TV business to Hisense; in 2018, it sold its computer business to Sharp; in 2022, it sold HVAC business to Carrier. It can be said that Toshiba is no longer a star representative of the Japanese economy, but is increasingly looking like a typical zombie company. If zombie companies like Toshiba can successfully delist, then for the Japanese market, it will be more like creating a new atmosphere.
This is just like investors in China’s A-shares market often complain that China’s stock market cannot usher in a bull market because of the lack of a reasonable delisting mechanism, which has led to many junk-listed companies dragging down the performance of A-shares. With Toshiba’s delisting, Japan seems to have taken a step ahead of A-shares in this regard and has begun to take the initiative to clear out zombie companies.
In addition to eliminating the remains of the old era, Japan seems to be paying more and more attention to cultivating the “unicorns” of the new era. During the “lost decades”, Japan has been criticized for its lack of innovative unicorns. As of the first quarter of this year, among the 1,026 unicorn companies in the world, Japan, the world’s third largest economy, only has six companies.
But all this seems to be changing. The past year 2022 was called the “Year of Entrepreneurship” in Japan. According to research by KPMG, Japanese startups raised a total of 877.4 billion yen in 2022, a record high. At the same time, these funds are not concentrated in traditional industries, but have poured into emerging industries such as the Internet, financial technology, new energy, and blockchain.
Driven by the new trend, Japan’s GDP in the second quarter of this year grew by as much as 6% year-on-year. Although it was later revised to 4.8%, this is still a very impressive result for a developed economy. Of course, just one-quarter GDP growth is certainly not enough to prove that the Japanese economy has completely escaped the lost decades. Moreover, such achievements are mainly achieved by relying on export growth, and Japan’s domestic personal consumption is still relatively weak. Therefore, we believe that the current Japanese economy does show some new trends, but whether it can continue in the future requires further observation to see whether Japanese citizens can be affected by these new trends, so as to increase personal consumption and investment, and whether integration of Japanese society can emerge.
Summary
• The extremely low financing cost of the Japanese yen and the continuous influx of foreign capital into the Japanese market have jointly promoted the rise of the Nikkei 225 Index.
• The “Buffett effect” further boosted Japanese stock market valuations.
• The future trend of the Nikkei 225 Index depends on Japan’s local economic and social fundamentals.
Disclaimer
Comments, news, research, analysis, price, and all information contained in the article only serve as general information for readers and do not suggest any advice. Ultima Markets has taken reasonable measures to provide up-to-date information, but cannot guarantee accuracy, and may modify without notice. Ultima Markets will not be responsible for any loss incurred due to the application of the information provided.
Written on November 13, 2023 at 9:06 am, by mervin
Comments Off on Given Japan’s Lost Decades, Why the Nikkei 225 Index Still Hit New Highs This Year?
In this comprehensive analysis, Ultima Markets brings you an insightful breakdown of the AUD/USD for 10th November 2023.
Key Takeaways
RBA raised interest rates: The Reserve Bank of Australia raised the cash rate by 25 basis points to 4.35% on Tuesday. Since the market had already expected the Reserve Bank of Australia to raise interest rates, the previous appreciation of the Australian dollar had already factored in this information. Subsequently, Bullock hinted that the obstacles to further tightening of policy have increased, causing the Australian dollar to fall.
The RBA is not strong: In fact, the market is pricing in not only an interest rate hike by the RBA in November, but also another interest rate hike in this cycle. But subsequent RBA statements failed to confirm this hawkish stance, instead taking a data-reliant approach to assessing the need for further tightening.
AUD/USD Technical Analysis
AUD/USD Daily Chart Insights
Stochastic Oscillator: After the indicator issued a short signal, it went all the way down. The short-term trend of the Australian dollar was confirmed to be depreciation. It is worth noting that it is close to the 50 mid-line, so be wary of a rebound or reversal.
Moving average combination: The exchange rate fell below the moving support formed by the 33-day and 65-day moving average combination. After the exchange rate closed below the 33-day moving average yesterday, the probability of the market continuing to decline increased.
Downward trend line: On November 1, the exchange rate broke through the downward trend line, and today it stepped back on the trend line. If there is any stop signal, the exchange rate still has the possibility of reversing upward.
AUD/USD 4-hour Chart Analysis
Stochastic oscillator: The indicator is not currently oversold, and there is a certain bottom divergence pattern in line with the market, suggesting that the current downward space is limited, and may enter an adjustment or even rebound next.
Fibonacci retracement level: Yesterday, the exchange rate fell rapidly to the 61.8% Fibonacci retracement level. Usually, such a rapid decline close to the resistance area has a certain probability of rebound.
Ultima Markets MT4 Pivot Indicator
According to the pivot indicator in Ultima Markets MT4, the central price of the day is established at 0.63814,
Bullish Scenario: Bullish sentiment prevails above 0.63814, first target 0.63991, second target 0.64461;
Bearish Outlook: In a bearish scenario below 0.63814, first target 0.63344, second target 0.63167.
Conclusion
Written on November 10, 2023 at 2:31 pm, by mervin
Comments Off on Focus on AUD/USD Today – 10th November 2023
Understanding the South Korean Currency Dynamics and Market Interventions
In the global financial landscape, the South Korean Won (KRW) has showcased a narrative of resilience and volatility in recent months, reflecting the intricate interplay of global economic forces and local regulatory interventions.
Let’s delve into the multifaceted factors contributing to the EBB and flow of the Won against the US dollar, examining how interventions and market movements have sculpted its trajectory.
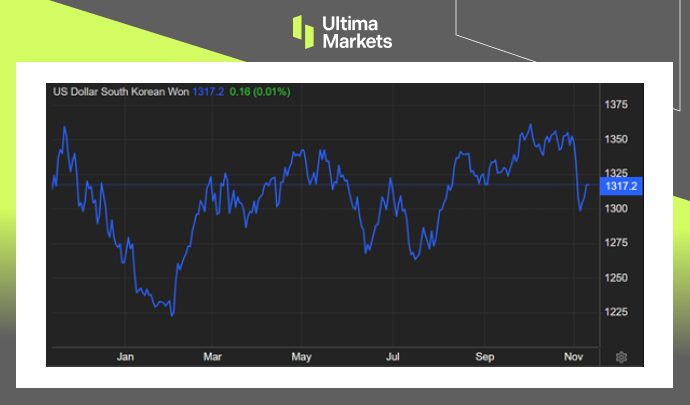
This resurgence owes itself to several factors, notably the perceptible weakening of the US dollar and a notable shift in the Federal Reserve’s stance towards a more dovish monetary policy. The termination of the rate-hike campaign from the Fed notably bolstered the Won’s value.
(USD/KRW One-year Chart)
Market Influence and Regulatory Actions
The Won’s resurgence was complemented by heightened foreign investment in the stock market, further underpinned by the decision of authorities to extend the ban on short selling until at least June of the following year.
However, despite these positive market movements, the year saw the Korean currency witnessing a 4% fall against the US dollar. This depreciation was propelled by multifaceted elements, including geopolitical risks, flight to safety, and a widening interest rate gap between South Korea and the US.
Market Intervention and the Central Bank’s Role
The Bank of Korea (BOK) played a pivotal role in curbing the Won’s depreciation, intervening in the forex market consistently throughout the year.
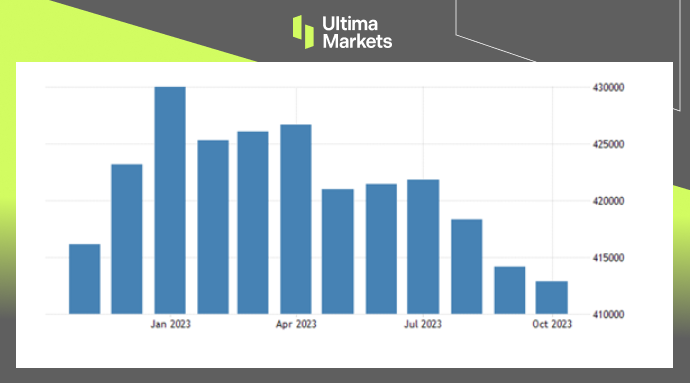
This proactive intervention led to a decline in foreign exchange reserves, which hit $412.87 billion in October, representing the lowest figures since June 2020.
Navigating Forex Reserves and Market Stability
South Korea’s foreign reserves faced a continuous decline, attributed to their utilization in stabilizing the foreign exchange market, a move sanctioned by the Bank of Korea.
By October’s closure, these reserves had diminished to $412.87 billion, showing a decrease of $1.24 billion from the prior month.
The breakdown of these reserves into various components like securities, deposits, special drawing rights, gold bullion, and IMF positions reflects a diverse strategy in safeguarding market stability.
Foreign Exchange Reserves Lowest in Over Three Years
South Korea’s foreign reserves fell for the third consecutive month as they were used to stabilize the foreign exchange market, according to the Bank of Korea (BOK). By the end of October, foreign currency reserves were $412.87 billion, down $1.24 billion from the previous month.
The reserves included $369.98 billion in securities, $18.87 billion in deposits, $14.77 billion in special drawing rights, $4.79 billion in gold bullion, and $4.45 billion in the IMF position.
South Korea remained the world’s ninth-largest holder of foreign reserves as of the end of September. Despite the declining trend, the central bank is not worried.
The BOK Governor Rhee Chang-yong said in late October that reserves have been stable since 2021 and increasing them further would come at a cost.
(Foreign Exchange Reserves, Bank of Korea)
Bottom Line
The South Korean currency’s trajectory reflects a dynamic interplay of global economic forces, market sentiments, and regulatory interventions.
As the authorities balance stability and growth, the resilience and adaptability of the Won against external pressures become increasingly evident.
Understanding this complex landscape is pivotal for stakeholders navigating the South Korean financial markets, highlighting the intricate balance between interventions and market dynamics.
Written on November 10, 2023 at 1:15 pm, by mervin
Comments Off on Korean Won Revived After Interventions by Korean Government
In this comprehensive analysis, Ultima Markets brings you an insightful breakdown of the BRENT OIL for 9th November 2023.
Key Takeaways
Global economic downturn: The overseas economic recovery is less than expected. For example, the U.S. unemployment rate has exceeded expectations in the past two months, and the new orders index has accelerated its contraction. This has led to doubts about the future demand for crude oil, and oil prices have followed the trend to chart the gains driven by early risk aversion.
The balance between S/D supports oil prices: The overall supply side of crude oil has not yet shown signs of tightening. In the long term, the supply and demand pattern is relatively loose, but in the short term there may be production cuts on the supply side, and there may be some support for prices.
Brent Oil Technical Analysis
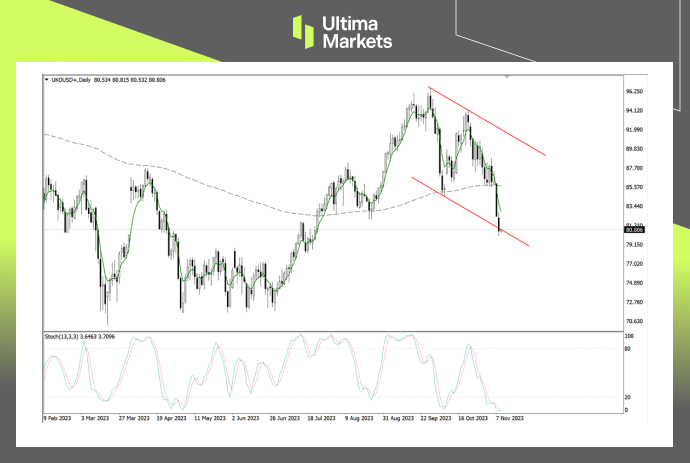
Brent Oil Daily Chart Insights
Stochastic Oscillator: The indicator has entered the oversold range, and the selling pressure is serious. You need to be alert to the coming of a short-term intraday rebound in the market.
Moving average: After the 5-day moving average completely fell below the 200-day moving average, the market did not show an effective rebound structure, and the two consecutive days of decline may take some time to correct. The rebound target price is looking towards the 5-day moving average.
Downward channel line: Since crude oil began to fall on September 27, the overall market trend has formed a downward channel line. Yesterday’s decline touched the lower edge of the channel line, and there is a certain probability of a rebound in the short term.
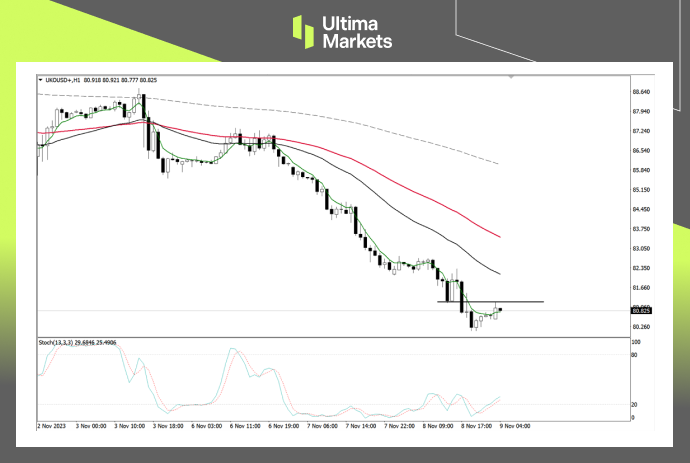
Brent Oil 1-hour Chart Analysis
Stochastic oscillator: The indicator has sent a long signal, and oil prices have a certain rebound momentum. However, oil prices cannot rebound lightly until they break through the 81.316 level.
Price Action: Oil prices are currently in a strong downward trend, and you cannot arbitrarily choose to enter the market at the bottom. Although the current indicators are suggesting that a rebound is imminent, we need to wait for a clear bullish structure before making a correction.
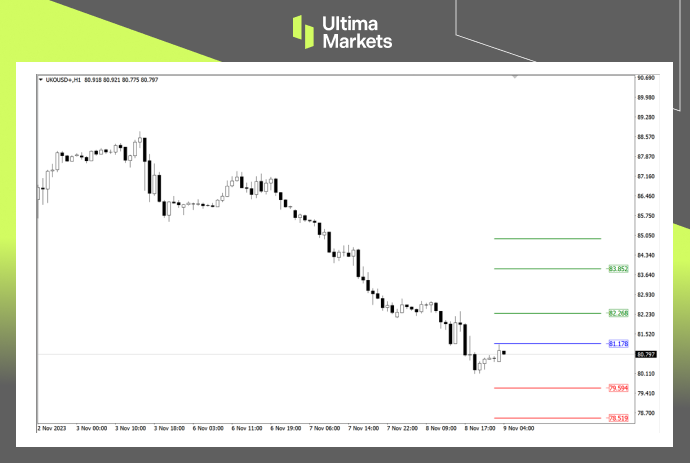
Ultima Markets MT4 Pivot Indicator
According to the pivot indicator in Ultima Markets MT4, the central price of the day is established at 81.178,
Bullish Scenario: Bullish sentiment prevails above 81.178, first target 82.268, second target 83.852;
Bearish Outlook: In a bearish scenario below 81.178, first target 79.594, second target 78.519.
Several factors contributed to the 0.1% month-on-month increase, including higher heating oil and air transport prices. Women’s coats and jackets, as well as foreign red wine, also experienced price hikes. On the other hand, prices for hotels, petrol, and fruiting vegetables declined.
Factors Driving Inflation
1. Energy Sector Impact
The month-on-month increase is partly attributed to higher heating oil and air transport prices. Switzerland’s strategic measures to navigate the challenges posed by escalating energy costs have not only maintained stability but have also propelled the nation forward.
2. Commodities Market Influence
Specifically noteworthy are the price hikes in women’s coats and jackets, alongside foreign red wine. These seemingly disparate sectors contribute to the intricate dance of the Swiss economy, showcasing adaptability in the face of diverse market forces.
3. Countering Declines
Conversely, certain sectors experienced price declines. Notably, hotels, petrol, and fruiting vegetables saw reduced prices. This balanced approach to inflationary pressures exemplifies Switzerland’s commitment to equilibrium in the marketplace.
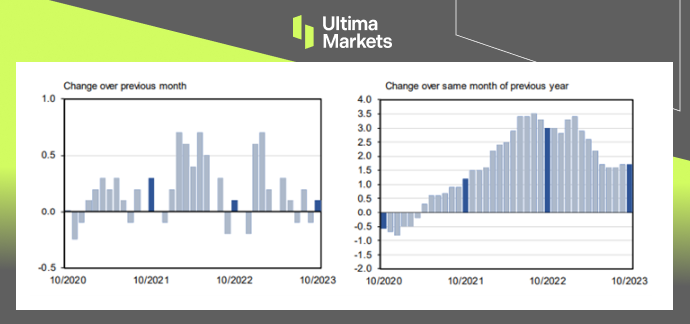
Harmonised Index of Consumer Prices (HICP)
The Harmonized Index of Consumer Prices (HICP) allows for inflation comparison between Switzerland and other European Union member countries, as it uses a standardized methodology across the EU.
The cost of living in Switzerland, as measured by the HICP, went up 0.1% for the third month running, indicating that inflation continued its gradual increase despite relatively low overall inflation numbers. On a year-over-year basis, it went up by 2.0%.
(Swiss Consumer Price Index, Federal Statistical Office FSO)
International Benchmarking
Switzerland, often overshadowed by its European counterparts, emerges as a beacon of fiscal prudence. Continuously surpassing both Germany and the European Monetary Union in inflation performance, Switzerland’s economic strategy underscores a commitment to outpacing global standards.
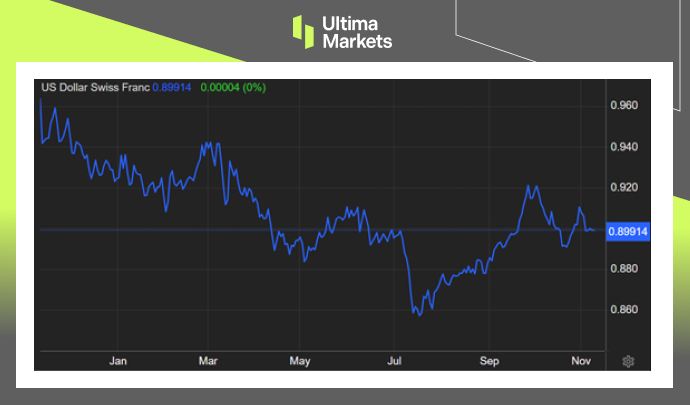
Swiss Franc Rebounds from One-month Low
Beyond inflation, the resurgence of the Swiss franc demands attention.
Rebounding from a one-month low, the franc strengthened beyond 0.9 per USD, marking a significant recovery from the four-week low at 0.91 on October 31.
This resurgence can be attributed to the proactive intervention of the Swiss National Bank (SNB)
(USD/CHF 1-year Chart)
SNB’s Strategic Intervention
The SNB’s substantial sale of foreign exchange reserves underscores a proactive approach to support the franc. This intervention, aimed at mitigating the impact of import inflation resulting from higher energy prices, showcases the SNB’s commitment to maintaining economic stability.
Foreign Exchange Dynamics
Remarkably, data from the SNB reveals that its foreign exchange reserves reached their lowest level in over five years in September. This deliberate reduction aligns with Switzerland’s strategic vision, prioritizing currency strength and resilience in the face of global economic challenges.
Bottom Line
In conclusion, Switzerland’s economic landscape stands as a testament to resilience, strategic planning, and fiscal prudence.
The nation’s ability to navigate inflationary pressures while concurrently bolstering its currency is a model for others to emulate.
As we delve into the intricacies of Switzerland’s economic narrative, it becomes evident that the nation’s commitment to stability positions it as a formidable force in the global economic arena.