Given Japan’s Lost Decades, Why the Nikkei 225 Index Still Hit New Highs This Year?

When it comes to the Japanese economy, that clichéd comment always pops up in our mind: “The Lost Decades.” Since the collapse of the bubble economy in the 1980s and 1990s, the Nikkei 225 Index has been sluggish. Especially when the COVID-19 epidemic broke out a few years ago, the Index once fell to a low of more than 16,000. Everything seems to indicate that the “lost decades” of Japan’s economy will continue.

The Nikkei 225 index, however, defied all logic by making a turnaround just after it hit bottom at the beginning of the recession. This year, on 19th of May, the Nikkei 225 index went beyond 30,800 points, achieving its highest level since 1990. That said, the Japanese stock market has kept rising ever since. It was as high as 33,000 just in June, beating most stock markets throughout the globe.

Why has the Japanese stock market, which has been in the doldrums for many years, been able to come back to life and continue to rise this year? After this round of surge, can the Nikkei 225 Index further continue its rise in the future? This article will take you to find out.

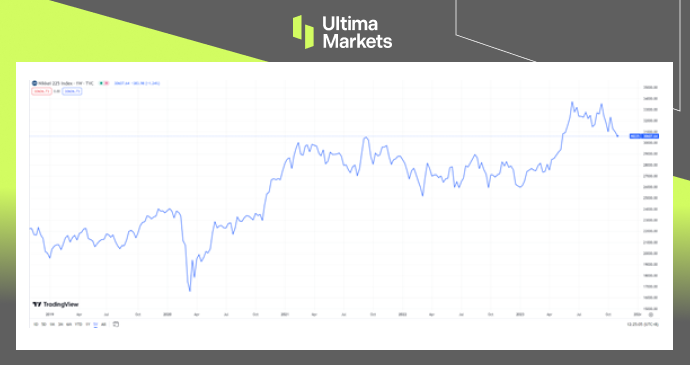
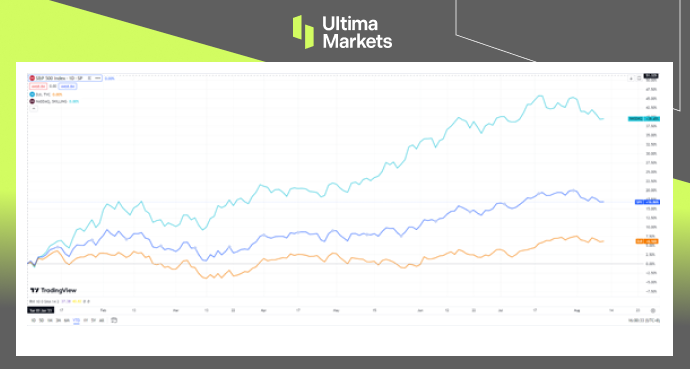
The performance of the Nikkei 225 Index in the past 5 years

The low financing cost of Japanese Yen

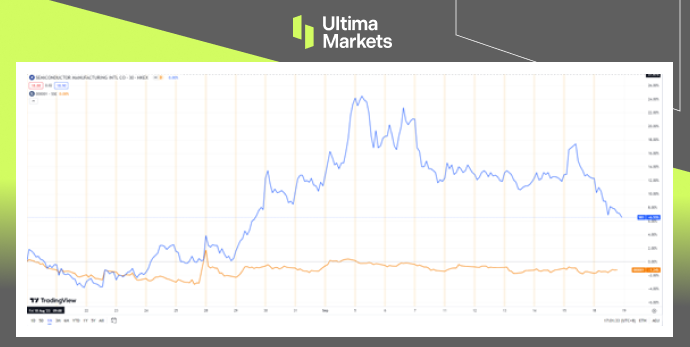
The exchange rate is usually crucial to a country’s stock market. For many non-U.S. currencies, once the domestic currency exchange rates against the U.S. dollar rise, the stock market prices will rise accordingly. China’s A-shares are a typical example. Once the RMB exchange rate against the U.S. dollar rises, the performance of A-share market will tend to start an upward trend. But Japan’s stock market is exactly a counterexample. In the past five years (as of the time of writing), the exchange rate of the Japanese yen against the US dollar has fallen by approximately 23.75%, but the Nikkei 225 index has increased by approximately 38%, obviously showing a negative correlation.

The reasons for this phenomenon mainly lie in two aspects:

  • Extremely low financing cost of Japanese Yen
  • Continuous inflow of foreign capital into Japan’s stock market

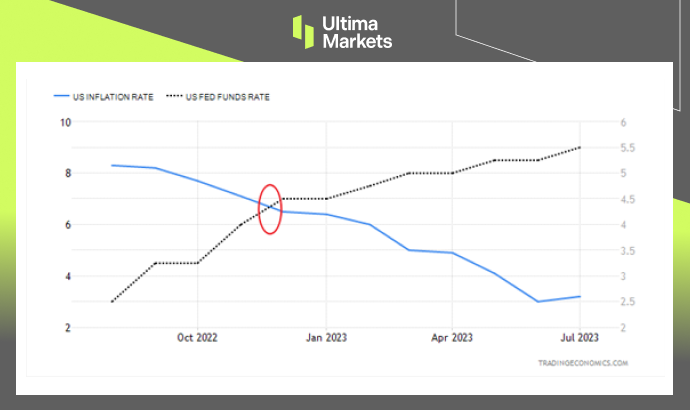
Since it is widely known that, following Japan’s economic bubble burst some thirty years ago, the BoJ has been engaged with slack monetary policies for quite some time in an endeavor at reviving market sentiment. It is clear that for so many years the Bank of Japan’s efforts to rehabilitate the market have gone unnoticed. However, those efforts helped to maintain Japan’s incredibly low-interest rates and finance costs. By lowering interest rates and purchasing government bonds, the Bank of Japan has effectively kept funding costs down. This means that businesses and investors can obtain funds at a lower cost, stimulating investment activity and increasing market liquidity. Low financing costs also provide companies with more room for capital returns, thus creating a basis for stock market gains.

Yet, it is no hidden secret that the Japanese yen has a very low cost of financing. This rate has been relatively low over multiple decades. So, the low financing rate by itself is definitely insufficient to justify the reason why the Nikkei 225 Index has shot up in the past few years. This leads to the second reason: the inflow of foreign capital.

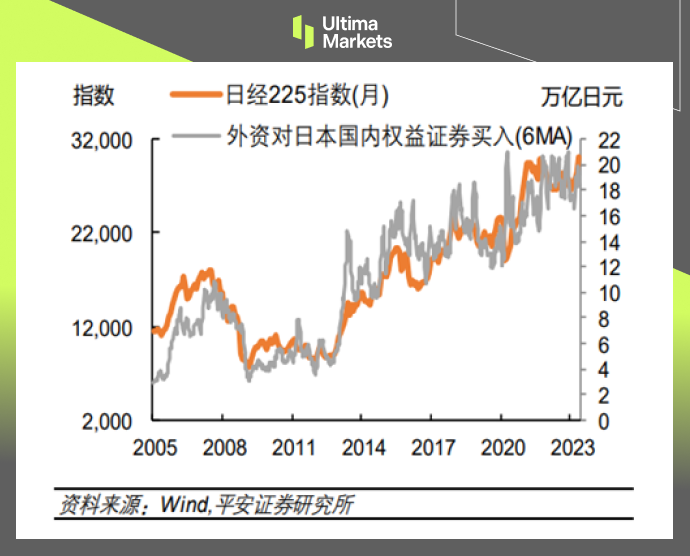
Foreign capital accounts for more than half of the trading volume in the Japanese stock market, and the flow of foreign capital has an important impact on the Japanese stock market. The internationalization of Japan’s securities market started early: Since the revision of the Foreign Exchange Law in 1980, Japan has relaxed restrictions on bond investment by non-residents; in 1989, foreign capital was allowed to set up funds for investment; in 1992, the threshold was significantly lowered further, which greatly facilitated foreign investment. Subsequently, the number and transaction volume of foreign investors continued to increase. As of 2021, the number of foreign investors in Japanese exchanges has risen to about 30%, and the trading volume of foreign investors has exceeded 60%. Since 2005, foreign investors’ purchases of Japanese domestic equity securities have shown obvious synchrony with the trend of the Nikkei 225 Index. This shows that the movement of foreign capital affects the performance of the Japanese stock market to a great extent.

The “Buffett Effect” boosts Japanese stock market valuations

The topic pertaining to foreign capital inflows should also not miss mentioning Buffett’s effect. Increasingly, foreign institutions that are associated with Buffet have improved their positions in Japan’s shares, which makes the Nikkei 225 Index grow. Already, in the opening years of the pandemic outbreak at this point (in 2020), Buffett had started buying equity shares in the country’s five leading exchange bodies. For example, during his speech in early May this year at a Berkshire Hathaway shareholder meeting, even Buffett declared these five companies to be “smart, big” and that they operate “intelligently”.
Everyone knows that Buffet is a “value investor” and a long-time investor in stocks with low prices. Buffet’s value investing entails screening for highly profitable firms, reliable cash flows, solid profitability records as well as outstanding leadership. Today, though Buffet continues to put more of his investment into Japanese companies and he views this as among the markets with great prospects for investment ventures. No doubt, this has attracted more market attention and enhanced the trend in the Japanese equity market.

First of all, Buffett’s investment behavior is seen as an endorsement of Japanese companies to some extent.  This will increase investors’ confidence in these Japanese-listed companies, thereby driving up stock prices.

Secondly, Buffett is led by long-term investment, and his investment behavior demonstrates his confidence in the long-term growth potential of the company. This long-term investment concept has a positive impact on encouraging investors to maintain a patient and persistent investment attitude. After seeing Buffett’s success in the Japanese market, investors also tend to adopt a longer-term investment strategy and hold stocks with more confidence, which in turn steadily promotes the rise of the stock market.

Can the Nikkei 225 Index continue its rise in the future?

Short-term funds may raise the trend for any country’s stock market in the short run, but the long-term success of a stock market depends on its fundamentals; therefore, the fundamentals of the Japanese stock market are no exception.

However, the Japanese economy has long faced a problem, that is, the existence of a large number of “zombie companies” that has hindered economic development. The so-called zombie companies refer to those companies that have stopped production, semi-stopped production, suffered losses for consecutive years, or are insolvent. They mainly rely on government subsidies and bank loan renewals to survive and operate. Since the Japanese economic bubble thirty years ago, the Bank of Japan has fueled bail-outs to a large number of companies in order to save the market, which has led to the existence of a large number of zombie companies.

On September 21 this year, Toshiba, a former symbol of Japan’s manufacturing industry and with a history of 150 years, was officially delisted. Many people believe that the collapse of Toshiba, a famous Japanese company, seems to mean that Japan’s manufacturing industry is losing its last fig leaf. But if we look at it from another perspective, we may have a completely different feeling.

Toshiba’s decline has actually been foreshadowed for a long time. As early as more than ten years ago, Toshiba’s operating income had been declining year by year. In this regard, Toshiba can only continue to “shut down departments” to survive. In 2015, Toshiba sold its image sensor business to Sony; in 2016, it sold its home appliance business to Midea; in 2017, it sold its TV business to Hisense; in 2018, it sold its computer business to Sharp; in 2022, it sold HVAC business to Carrier. It can be said that Toshiba is no longer a star representative of the Japanese economy, but is increasingly looking like a typical zombie company. If zombie companies like Toshiba can successfully delist, then for the Japanese market, it will be more like creating a new atmosphere.

This is just like investors in China’s A-shares market often complain that China’s stock market cannot usher in a bull market because of the lack of a reasonable delisting mechanism, which has led to many junk-listed companies dragging down the performance of A-shares. With Toshiba’s delisting, Japan seems to have taken a step ahead of A-shares in this regard and has begun to take the initiative to clear out zombie companies.

In addition to eliminating the remains of the old era, Japan seems to be paying more and more attention to cultivating the “unicorns” of the new era. During the “lost decades”, Japan has been criticized for its lack of innovative unicorns. As of the first quarter of this year, among the 1,026 unicorn companies in the world, Japan, the world’s third largest economy, only has six companies.

But all this seems to be changing. The past year 2022 was called the “Year of Entrepreneurship” in Japan. According to research by KPMG, Japanese startups raised a total of 877.4 billion yen in 2022, a record high. At the same time, these funds are not concentrated in traditional industries, but have poured into emerging industries such as the Internet, financial technology, new energy, and blockchain.

Driven by the new trend, Japan’s GDP in the second quarter of this year grew by as much as 6% year-on-year. Although it was later revised to 4.8%, this is still a very impressive result for a developed economy. Of course, just one-quarter GDP growth is certainly not enough to prove that the Japanese economy has completely escaped the lost decades. Moreover, such achievements are mainly achieved by relying on export growth, and Japan’s domestic personal consumption is still relatively weak. Therefore, we believe that the current Japanese economy does show some new trends, but whether it can continue in the future requires further observation to see whether Japanese citizens can be affected by these new trends, so as to increase personal consumption and investment, and whether integration of Japanese society can emerge.

Summary

• The extremely low financing cost of the Japanese yen and the continuous influx of foreign capital into the Japanese market have jointly promoted the rise of the Nikkei 225 Index.

• The “Buffett effect” further boosted Japanese stock market valuations.

• The future trend of the Nikkei 225 Index depends on Japan’s local economic and social fundamentals.

Disclaimer 

Comments, news, research, analysis, price, and all information contained in the article only serve as general information for readers and do not suggest any advice. Ultima Markets has taken reasonable measures to provide up-to-date information, but cannot guarantee accuracy, and may modify without notice. Ultima Markets will not be responsible for any loss incurred due to the application of the information provided.

When China’s A-Shares Markets Can Bounce Back? 

For investors investing in China’s A-shares, the performance of China’s stock market so far this year has only been slightly impressive at the beginning of the year. However, as China’s economic recovery gradually falls short of expectations, and the exchange rate of CNY/USD continues to fall, the performance of A-shares has also declined. Although there are frequent rumors in the market that China will launch large-scale stimulus, it turns out there is always loud thunder but little rain. 

On August 27, the China Securities Regulatory Commission finally introduced a series of favorable policies such as halving stamp. However, at the opening of the next day, the three major A-share stock indexes only rose for a short period of about 1 minute, then fell back one after another. As a result, many Chinese netizens commented: “I’m optimistic about the fate of the country but choose to bet on the Nasdaq.” 

In today’s turbulent international political and economic situation, can China’s A-shares break out of the siege and turn the tide? This article will take you to find out. 

Why the large stimulus isn’t coming? 

In addition to the need to wait for the RMB exchange rate to strengthen, whether China can introduce large-scale stimulus measures is also an important factor in the strength of the A-shares market. However, it seems that China is quite conservative about the introduction of stimulus measures. Not only is the intensity of the stimulus measures currently introduced not large, but the speed of introduction is as fast as squeezing out toothpaste, and China has not shown that it plans to launch large-scale stimulus. 

On September 15, the People’s Bank of China decided to lower the deposit reserve ratio of financial institutions by 0.25 percentage points for the second time this year. Although it lowered the required reserve ratio, it did not lower interest rates. Therefore, the market reaction was also calm. In the end, the Shanghai Composite Index even closed down 0.28% that day. It can be seen that the so-called rescue efforts obviously did not meet market expectations. 

So here comes the question. Since the market now knows that large-scale stimulus will likely solve the current predicament of A-shares, why is there still no such stimulus? 

Just in mid-August, Ray Dalio, the founder of Bridgewater Associates, the world’s largest hedge fund, publicly stated that China is in urgent need of reducing leverage. His remarks may explain why China has been slow to introduce large stimulus policies. As we all know, debt is a double-edged sword. When maintained at the right level, it can provide upward momentum for national economic growth. However, once the critical threshold is exceeded, debt will undoubtedly have a negative impact on the economy. 

In fact, as early as a few years ago, China had begun to continuously publicize that it would embark on a “road to deleveraging.” In 2018, China’s macro leverage ratio was about 240%. However, in recent years, with the outbreak of the epidemic and changes in the economic situation, the leverage ratio has not only not declined, but has risen to about 280%. Therefore, although large-scale stimulus policies are almost the only prescription to boost China’s stock market in the short term, China will obviously remain cautious about stimulus policies under the urgent need to reduce leverage. 

hina's leverage ratio has remained high for several years.

China’s leverage ratio has remained high for several years. 

Can A-shares get better in the future? 

Since it is difficult to implement stimulus measures on a large scale at the moment, does this mean that A-shares are hopeless? Whenever this happens, you will definitely hear some so-called stock commentators say: “Although A-shares are under pressure in the short term, their long-term fundamentals are good.” In our opinion, such similar remarks are probably just half true. Although A-shares are under pressure in the short term, their long-term fundamentals may not be completely positive

Why? To answer this question, we must start with the composition of A-shares

If we talk about the market capitalization leaders or star stocks in A-shares, investors may first think of consumer or financial banking stocks such as Kweichow Moutai, Ping An, and Industrial and Commercial Bank of China. Correspondingly, when talking about the leading stars of the US stock market, Apple, Tesla, Nvidia, Amazon, etc. may come to mind, but these companies basically belong to the technology industry

In fact, this stereotype aligns with the current status of the A-share and US stock markets. Let’s take the FTSE China A50 Index (composed of the top 50 A-share stocks by market capitalization) as an example. The figure below shows that among the top 50 stocks by market capitalization, the financial industry accounts for 28.25%, and the core consumer industry accounts for 30.77%. These two major industries undoubtedly occupy the majority. 

Breakdown of industries in FTSE A50 Index 

Breakdown of industries in FTSE A50 Index 

But the problem lies precisely with these two industries. The first is the consumer industry. Since China has continued to show a “consumption downturn” this year, the consumer industry will naturally bear the brunt of the impact. This can also be reflected in the rise and fall of CPI (Consumer Price Index). As can be seen from the chart below, since entering 2023, China’s CPI trend, if not a recessionary trend, has at least shown a sideways trend. And this is naturally not good news for the core consumer industry. Consumption needs a trend toward inflation to realize that consumer prices can rise, allowing relevant companies to reap higher profits. But once the consumption level falls into a sideways situation, the relevant company’s growth expectations will naturally be greatly restricted. 

Rise and fall of China’s CPI in the past year. 

Rise and fall of China’s CPI in the past year. 

Then, let’s talk about the financial industry. Financial stocks in China’s A-share market are actually mainly banking stocks such as China Merchants Bank, Industrial and Commercial Bank of China, and Agricultural Bank of China. In the current economic environment in China, the growth expectations of bank stocks are subject to a key factor, which is net interest margin. The so-called net interest margin refers to the ratio of the bank’s net interest income to the bank’s total interest-earning assets. To put it simply, the net interest margin is equivalent to the profit margin of the banking industry. The higher the net interest margin, the higher the bank’s profitability and vice versa. 

The chart below shows the net interest margin trend of China’s banking industry since 2011. As can be seen from the figure, the net interest margin of China’s banking industry has shown a clear downward trend in the past 10 years. And this is naturally not a good thing for banks that rely on net interest margins to make profits. 

Trend of net interest margin of China’s banking industry since 2011. 

Trend of net interest margin of China’s banking industry since 2011. 

All in all, the current market structure of A-shares is basically dominated by the consumer industry and the financial and banking industries, and such a market structure is unable to support a higher market value. If A-shares really want to rival U.S. stocks in the future and achieve a long-term bull market, they will inevitably need to let their leading market value companies gradually shift to high-value-added industries such as the technology industry or the medical industry. Only by allowing these industries to take a dominant position can A-shares truly achieve “good long-term fundamentals.” 

Breakdown of industries of shares in S&P 500 Index

Breakdown of industries of shares in S&P 500 Index 

When the A-shares markets can rebound? 

So can A-shares make those high-value-added technology industries the market capitalization leaders in the future? Combined with the continuous technological blockade imposed by the United States and other Western countries on China in recent years, it seems that there is little hope of achieving this goal. But what is surprising is that Huawei, which has been subject to US technology sanctions for four years, suddenly released the latest Mate 60 series mobile phones in a low-key manner without any publicity and promotion. Confirmed by Bloomberg News, its SoC adopts the 7nm process and is manufactured by SMIC. For China’s technology industry, this is undoubtedly the first glimmer of light after a long dark night. The blue line in the figure below represents the trend of SMIC share price in the Hong Kong stock market in the past month, while the orange line represents the trend of the Shanghai Composite Index during the same period. 

The comparison of SMIC and Shanghai Composite Index in the past month 

The comparison of SMIC and Shanghai Composite Index in the past month 

As we all know, China’s rapid economic development in the past two decades began with the real estate economy led by land finance. In combination with the foreign trade export industry, which was originally labor-intensive, it also created jobs for the city, thereby promoting urbanization development. However, as the international economic situation has become more turbulent in recent years, the demand for imported goods from China to developed countries such as Europe and the United States has continued to decline. The export-oriented export industries in the past have been hit first, which in turn has reduced urban employment, thus further accelerating the growth of China’s real estate industry.  

Therefore, given China’s current economic situation, continuing to follow the old path of land finance or mid- to low-end foreign trade exports is definitely not a long-term option. If China wants to reverse its current sluggish economy and A-share dilemma, industrial upgrading is the only way. Because in the macro division of labor in the international industrial chain, using the so-called cheap demographic dividend to develop foreign trade OEM production is inherently the lowest-profit link. Only by occupying high-end links such as R&D and design and changing China’s current position in the international industrial chain can it bring more income to the overall economy and individual consumers. Only when incomes begin to truly increase and people’s expectations for the future improve, will China’s economy and the A-share market truly improve. 

Summary 

  • The Chinese market needs large-scale stimulus in the short term, but the large stimulus will not be conducive to long-term development. Therefore, the current stimulus measures introduced by China are relatively restrained, and the actual intensity is not particularly large. 
  • Since the current industry structure of the A-share market is mainly focused on finance banking or consumption, and lacks high-value-added industries, it is impossible to essentially improve the long-term market conditions of A-shares. 
  • Only by accelerating industrial upgrading can fundamentals of A-shares market truly improve in the future. 

Disclaimer 

The comments, news, research, analyses, prices, and all information contained in this article can only be regarded as general information and are provided only to help readers understand the market situation and do not constitute investment advice. Ultima Markets has taken reasonable steps to provide up-to-date information, but cannot guarantee the accuracy and may modify without notice. Ultima Markets will not be responsible for any loss incurred due to the application of the information provided. 

What is the Fed’s Next Move After Jackson Hole? 

As a mouthpiece of the Fed, the Jackson Hole Economic Symposium always attracts the eyeballs of numerous investors. Considering the current turbulent global economic situation, this year’s meeting is undoubtedly eye-catching. The three-day symposium officially ended in August, and the speeches of renowned financial names captured the world’s attention. 

This article is going to unriddle hidden messages in speeches and help you get insight into future investment trends. 

Fed message iterated and no rate cuts in sight  

The spotlight at the meeting was the speech by Federal Reserve Chairman Jerome Powell. He patiently reiterated the importance of U.S. interest rate decisions on inflation: “The Federal Reserve’s responsibility is to reduce inflation to the 2% target. Although inflation has fallen from highs, it is considered too steep. The Fed will be prepared to raise interest rates further if necessary and keep restrictive policies going until it is confident that inflation will fall sustainably toward the target. ” From the words, the Fed still attaches great importance to achieving the inflation target, and it also greatly dispels market expectations for interest rate cuts.    

Inflation downtrend becoming stagnant 

Judging from the figures released, although the economy has slowed down somewhat, consumption seemingly remains intact. After falling from highs, price levels have entered a stagnant state. This phenomenon will undoubtedly arouse market concerns in the high-interest rate environment. The U.S. Department of Commerce reported on July 28th that the personal consumption expenditures (PCE) index increased by 3.0% year-on-year in June, slightly lower than market expectations of 3.1%. Food and energy prices are susceptible to fluctuations due to global factors, which may send misleading signals to the inflation outlook. Therefore, the Fed focuses more on core PCE inflation. Excluding food and energy prices, core PCE increased by 4.1% year-on-year in June, which was lower than market expectations of 4.2% and 4.6% of the previous value, the smallest increase since September 2021. The U.S. Department of Commerce announced on August 31 that PCE increased by 3.3% annually in July, in line with market expectations. The core PCE increased by 4.2% year-on-year in July, slightly higher than the 4.1% in June, but in line with market expectations.  

(Core Personal Consumption Expenditure PCE Index, Investing.com) 

Resilient labor market 

In addition, the job market continues to remain resilient, indicating that the U.S. economy not heading for a recession. However, inflation seems to be difficult to decline further as a result. The U.S. Department of Labor announced that nonfarm payroll increased by 187,000 in July, slightly lower than market estimates of 200,000. Although the number missed expectations, it actually went up from the downward revision of 185,000 in June. The unemployment rate was 3.5%, while the market consensus expected the unemployment rate to remain stable at 3.6%. The unemployment rate is slightly higher than the lowest level since late 1969. The average hourly wages, the Fed’s compass for inflation, rose 0.4% for the month and at an annual rate of 4.4%. Both figures were 0.3% and 4.2% higher than their respective forecasts.  

Consult history when observing reality, Reality does not exist without history

As we look for today’s answer from history, it is not difficult to discover the Fed’s concerns and why the chairman often adopts a reserved tone in his remarks. The long-run quantitative easing policy has made people accustomed to the low-interest environment. How did people deal with inflation? Is there a period in history that matches the present so that we can find clues? From the comparison of the diagram below, we can see that the yellow curve, representing CPI from 2013 to 2023, closely replicates the one dated 1966 to 1976 (blue line), with inflation rising sharply and then cooling down after being controlled. When the time sequence entered the late 1970s, the revolution in Iran caused tension in the oil market, and inflation soon reignited. The international crude oil price soared from about $15 per barrel in 1979 to doubling to $ 39 in February 1981. Price levels went skyrocketed. The late 70s CPI soared higher than the peak in 1974-75! Now, OPEC+ allies are implementing a voluntary production reduction policy until the end of the year in an attempt to deepen their operations in the oil market. As expected, oil prices have reached the year-to-date high of $90 per barrel at the beginning of autumn. Although economic data show inflation has cooled, history tells us it is hard to defeat. The oil cuts have fostered uncertainties on the path to winning the inflation battle. The Federal Reserve must stay alert and respond fast. Whenever there is an overly optimistic atmosphere in the market, the Federal Reserve will release a hawkish message to suppress it, conveying that interest rates must remain high and last longer. Its verbal warning works best when the global economic environment is fragile.  

(US CPI YoY%, 1966-1982 Blue Line V.S. 2013-2023 Yellow Line) 

Natural rate of interest possibly rises over time  

The natural rate of interest (r-star) has recently become a popularly debated topic among Fed officials, and some officials believe the neutral rate of interest might have gone up. The r-star is the real interest rate set by the central bank to keep the economy operating at full employment and price stability. Simply saying, at the neutral interest rate, the economy is neither expanding nor contracting. According to data from the Federal Reserve Bank of New York, r-star has been between 2.0% and 3.5% from 2000 to 2009 and remained near 1.0% since then. The Federal Reserve Bank of New York estimates that the current r-star hovers between 0% and 0.5%. Without the monetary easing policy, the U.S. economy seems to be intact and still running well in a relatively high interest-rate environment. Does this mean that the neutral interest rate has already quietly rebounded? However, the neutral interest rate has always been an abstract observation tool, which is not easy to measure and can only be reviewed after the fact occurs. With the uprise of the new economy and geopolitical risks, the Federal Reserve’s mission has become more complex, and monetary policy must become innovative and not limited to interest rate setting. What is certain is that the market’s desire to return to the ultra-low interest times of the past no longer exists.  

(Natural rate of interest r-star, Fed NY)  

Summary 

As Powell said, the Fed still needs to work harder to bring inflation down to 2% sustainably, and this may require two conditions: A period of low economic growth and a cooling labor market. Speaking of economic growth, GDP growth in 1H23 is higher than the long-term trend, and recent consumption data has also been particularly strong. As for the labor market, it has been rebalancing over the past year.  

Therefore, monetary policy needs to remain flexible. It is expected that interest rates will be raised again in September or November, while the interest rate cut expected by the market may have to wait until the second half of 2024. According to FedWatch, CME Group’s interest rate forecast tool, after Jackson Hole, the probability that the Fed will not raise interest rates in September has risen to 88.5%. Certainly, we cannot rule out the possibility that unexpected situations may occur, resulting in the Fed eventually raising interest rates in September.  

Disclaimer 

The comments, news, research, analyses, prices, and all information contained in this article can only be regarded as general information and are provided only to help readers understand the market situation and do not constitute investment advice. Ultima Markets has taken reasonable steps to provide up-to-date information, but cannot guarantee the accuracy and may modify without notice. Ultima Markets will not be responsible for any loss incurred due to the application of the information provided. 

Assessing the Possibility of a US Recession in 2023 | In-depth Analysis


Is a US Recession in 2023 Likely?

Let’s turn the clock back to the end of last year. At that time, most investors and economists predicted that the US economy would inevitably suffer a recession in 2023 because of the environment of high interest rates.

But today, at the end of July, the Federal Reserve once again raised the federal funds rate by 25 basis points, lifting the target range of the rate to 5.25% to 5.5%, the highest level since 2001.

However, the US economy shows no sign of recession. As of writing, the US NASDAQ, S&P 500 and Dow Jones index went up 39.45%, 16.86% and 6.16% respectively so far this year.

So, will there still be a recession? If there is still the possibility of a recession, when will it happen?

The three major indexes of U. S. stocks are still rising so far this year.


Current situation: the market is still strong

Judging from the current market situation, the US Commerce Department announced on July 27th that GDP in the second quarter of this year grew 2.4% from a year earlier, up from 2% in the first quarter.

At the same time, the Ministry of Commerce said that compared with the first quarter of this year, the higher GDP growth rate in the second quarter reflected a rebound in private sector inventory investment and an increase in non-residential fixed investment. This seems to suggest that the US economy will not experience a hard landing any time soon.

Coincidentally, the US labor market has also shown resilience. The labor department announced on August 4th that the unemployment rate fell to 3.5% in July, down 0.1% from June and nearing a half-century low, while wages rose slightly, with the average hourly wage rising 0.4% in July from a year earlier. The current low unemployment rate also reflects a robust US economy.

Let’s take another look at the inflation data that the Fed is most concerned about. The US Bureau of Labor Statistics reported that the consumer price index (CPI) rose 3.2% in July from a year earlier, up slightly from 3% in June, reflecting rising food prices and still high housing costs.

But beyond that, the rest of the inflation-related data was mostly good news, especially the core CPI data, which excludes food and energy items, slowed further from a year earlier, from 4.8% in June to 4.7% in July. Although inflation has not been suppressed yet, the overall situation has improved significantly than before.

In short, there is a lot of data showing that market vitality is still strong, and it seems that the risk of recession is getting farther and farther away.


Looking back on history: the Truth behind high interest rates

Although the US economy is not showing obvious signs of recession at the moment, is this enough to indicate that recession fears are not enough to worry about? As the saying goes, there is nothing new under the sun. If we look back on history, it is not difficult to find that this may not be the time to rest easy.

In February 2008, it was only months before the collapse of 158-year-old Lehman Brothers. But Ben Bernanke, then chairman of the Federal Reserve, said that while the economic situation was not optimistic, he did not think the US economy would be at risk of recession. And at that time, there were not a few economists who supported this view.

When it comes to the financial crash that swept the global economy in 2008, this crisis actually did not appear at the peak of the high interest rate environment. Contrary to most people’s stereotype, the “Lehman moment” came after the Fed had cut interest rates sharply in a row.

In order to cool the apparently overheated housing market at that time, the Federal Reserve raised the federal funds rate to a high of 5.25% on June 29, 2006, and maintained it for more than a year.

It was not until September 18, 2007, that interest rates were cut by 50 basis points. By the time Lehman collapsed in September 2008, the federal funds rate had already fallen to 2%, entering a low-interest environment.

So, here comes the question, why is the recession still breaking out when interest rates have fallen and the pressure for high interest rates is gone? To answer this question, we need to quote an economic concept here: real interest rate.

The so-called real interest rate refers to the real interest rate level shown by the nominal interest rate after excluding the impact of inflation. If it is expressed in a mathematical formula, it is:

Real interest rate = Nominal interest rate – Inflation rate

Understanding the concept of real interest rates will be of great significance for us to analyze the truth behind high interest rates in the United States! Because corporate borrowing is a normal phenomenon in economic activity. Since borrowing is involved, interest rates are naturally an unavoidable topic. Only at favorable interest rates can the economy get a corresponding boost.

Let’s give a few simple examples here. It is a well-known fact that the inflation rate in the United States remained high last year. Let’s assume that at some point last year, inflation rate was as high as 8%, while the nominal interest rate in the United States was 4%. The high interest rate level of 4% seems to put a lot of pressure on corporate borrowing. However, once we introduce the concept of real interest rate, we will find that the interest rate level of 4% interest rate will not cause any pressure.

Because 4% (nominal interest rate) minus 8% (inflation rate), you get a real interest rate of -4%. At this time, the real interest rate is simply negative. In other words, although enterprises bear the cost of interest rates of 4%, due to the existence of 8% inflation, the prices of products or services produced by enterprises will naturally be pushed up by 8% by inflation.

As a result, enterprises can still make a profit of 4% just from borrowing. Therefore, as long as the real interest rate is negative, simply high nominal interest rates will not necessarily have a recession impact on the economy, because the cost of debt is negative. This is the reason why U. S. stocks still rise all the way in a high interest rate environment.

But let’s give another example. What if nominal interest rates go up all the way and inflation rate starts to fall? For example, suppose the nominal interest rate rises to 5%, while inflation falls to 3%. In this case, the real interest rate becomes +2%, and the previously negative cost of debt has been completely turned into a positive number. And this is what is happening to the US economy right now.

So, what kind of pressure will happen to the economy once real interest rates are negative? With regard to this question, we only need to look back at the past history and the answer is clear at a glance.

The trend of US inflation and the federal funds rate over the past 25 years.

The blue line: the US inflation rate; the black line: the federal funds rate (or the nominal interest rate).

By looking at the chart above, we can clearly see that in the past 25 years, there are two time periods when the nominal interest rate is higher than the inflation rate, or namely the real interest rate is positive. These two time periods correspond to the two red circles in the above chart.

These two periods roughly correspond to the dotcom crisis in the United States in 2000-01 and the global financial crisis in 2007-08. Thus, when the cost of debt is negative, economic activities tend to develop smoothly, and once the cost of debt is positive, crises often follow.


Outlook: the hidden danger of recession has not been eliminated

Bloomberg conducted a poll among economists last December when 70% of economists thought the US economy would suffer a recession within the next 12 months. But by July this year, that number had fallen to 58%.

Similar surveys are common in many mainstream financial institutions. Goldman Sachs, which thought there was no recession in the US economy as early as last year, further lowered the probability of a recession in the next 12 months to just 20% in July.

It seems that the risk of recession has once again been forgotten by economists. But through the above analysis of real interest rates and a review of history, we can see that the hidden dangers of the current recession have not been completely eliminated.

The trend of US inflation and the federal funds rate over the past year.

The blue line: the US inflation rate; the black line: the US federal funds rate (or the nominal interest rate).

The chart above reflects the trend of US inflation and the federal funds rate over the past year. The red circle in the picture reflects that real interest rates have reached a turning point from negative to positive at the end of last year and the beginning of this year.

Of course, the real interest rate can only be regarded as a temporary transition from negative to positive. But it is not clear whether this situation will last for a long time in the future. If the Fed adjusts its interest rate policy in time, or if inflation rises repeatedly, real interest rates are still likely to return to negative territory. In short, real interest rates already pose a potential danger to the possible risk of recession.

Just as real interest rates in the US showed signs of turning from negative to positive, in August, Fitch Ratings, one of the world’s three largest rating agencies, suddenly downgraded the US credit rating, downgrading its long-term rating from “AAA” to “AA+”. For the downgrade, Fitch said it was mainly due to several key drivers:

  • 1.The level of governance in the United States has deteriorated:

Federal debt has remained high for years, and repeated debt-limit political standoffs and last-minute resolutions have eroded confidence in fiscal management. All these show that the level of governance in the United States has deteriorated, and public confidence in the government’s financial management has also been undermined.

  • 2.Rising government deficits:

Fitch expected the general government deficit to rise to 6.3% of GDP in 2023, from 3.7% in 2022, reflecting cyclically weaker federal revenues, new spending initiatives and a higher interest burden. Additionally, state and local governments were expected to run an overall deficit of 0.6% of GDP this year after running a small surplus of 0.2% of GDP in 2022.

Fitch also forecasted a government deficit of 6.6% of GDP in 2024 and a further widening to 6.9% of GDP in 2025. The larger deficits will be driven by weak 2024 GDP growth, a higher interest burden and wider state and local government deficits of 1.2% of GDP in 2024-2025.

  • 3.General government debt to climb:

Fitch predicted that US general government debt as a share of GDP will continue to climb, reaching 118.4% in 2025. That is more than 2.5 times higher than the median of 39.3% for “AAA” and 44.7% for “AA” sovereign countries. Fitch’s long-term forecasts show that the debt-to-GDP ratio will rise further, which will increase the vulnerability of US finances to future economic shocks.


Summary

It is worth mentioning that the fattest brown bears usually exist in the autumn before hibernation, and when winter goes to spring, brown bears are instead the weakest.

It is as if before the recession, countries often had plenty of tools in their fiscal toolboxes, which needed to be consumed in order to deal with risks. If there is a day when there are few fiscal instruments left, leaving the Fed with no choice but to slash interest rates, a recession will then be inevitable.

Therefore, in the future, the market should no longer pay more attention to whether the Fed will continue to raise interest rates, but instead focus on what attitude or way the Fed will use to create the expectation of interest rate cuts in the future. This will deserve further attention from the market in the future.