In this comprehensive analysis, Ultima Markets brings you an insightful breakdown of the AUDUSD for 15th November 2023.
Key Takeaways
- CPI hits the dollar: U.S. October CPI and core CPI data were both lower than expected, and interest rate futures price the Fed’s current interest rate hike cycle to a complete end
- The Fed’s interest rate cut cycle is coming: The overall interest rate hike cycle is expected to end, leading the market to begin to expect a cumulative 100 basis points interest rate cut by the end of next year, with the first round of interest rate cuts as early as May. These have put extreme pressure on the dollar to sell off.
Technical Analysis
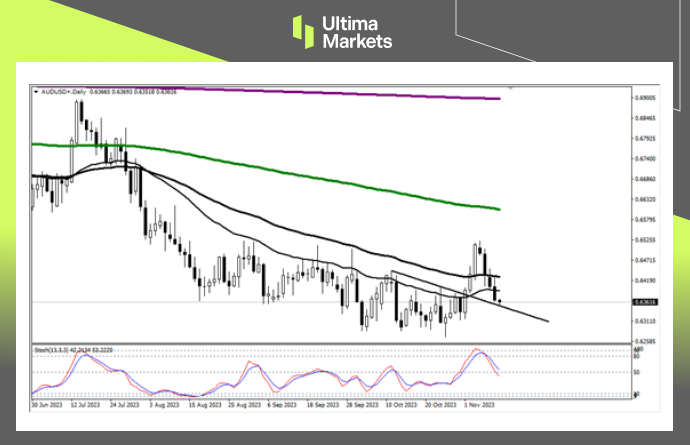
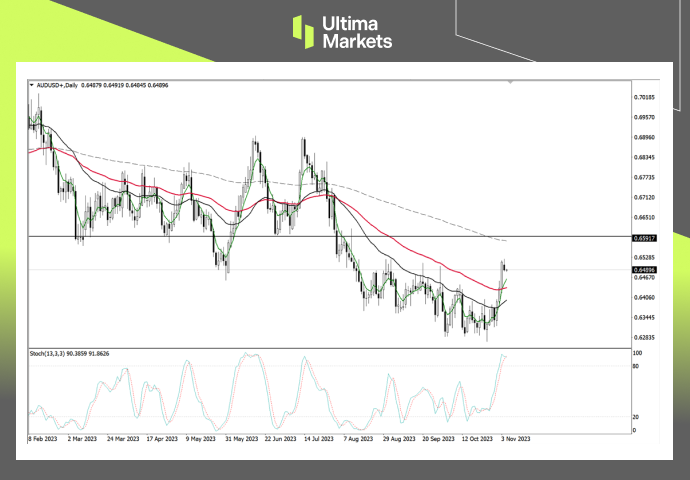
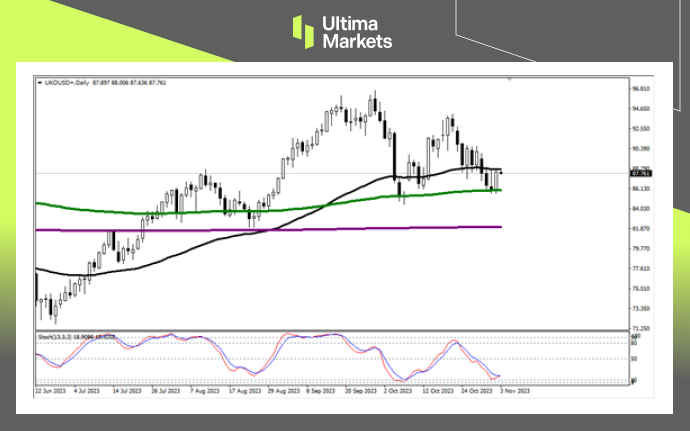
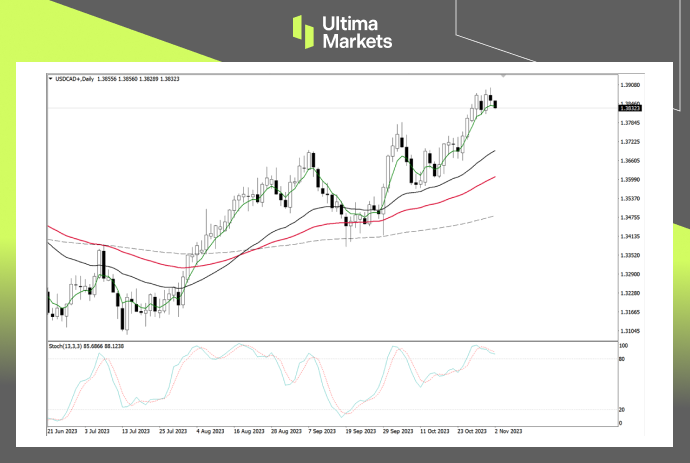
Daily Chart Insights
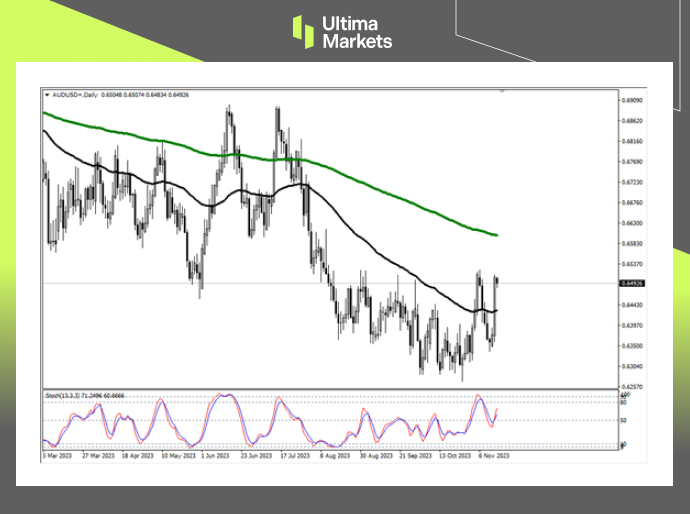
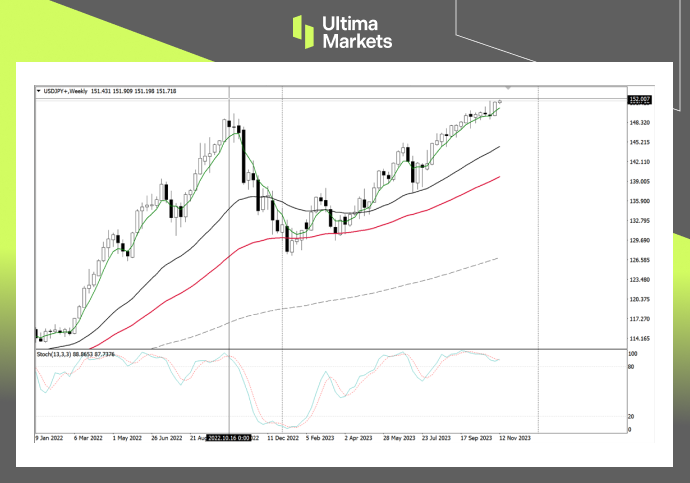
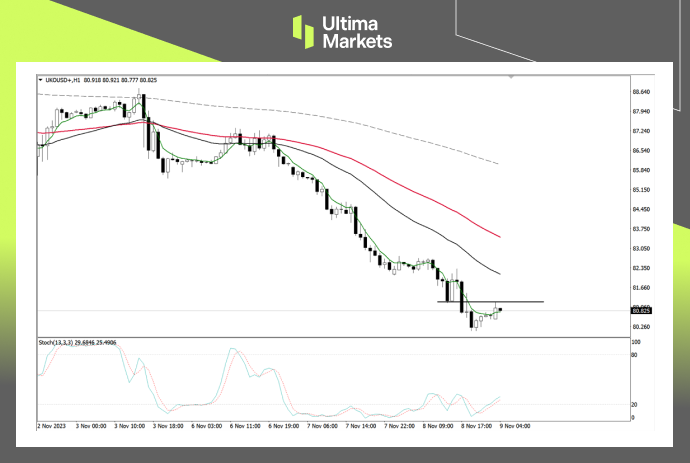
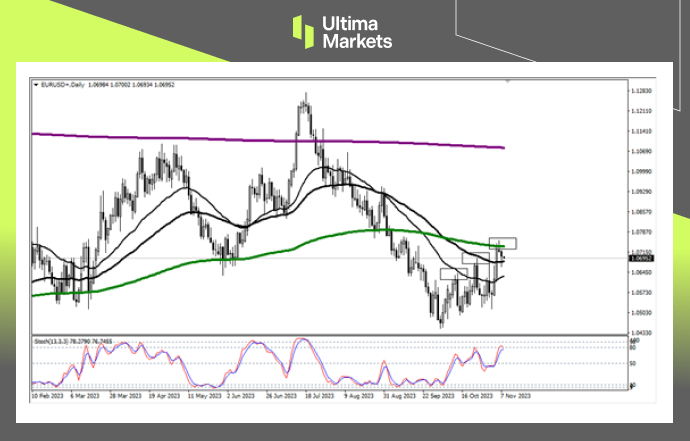
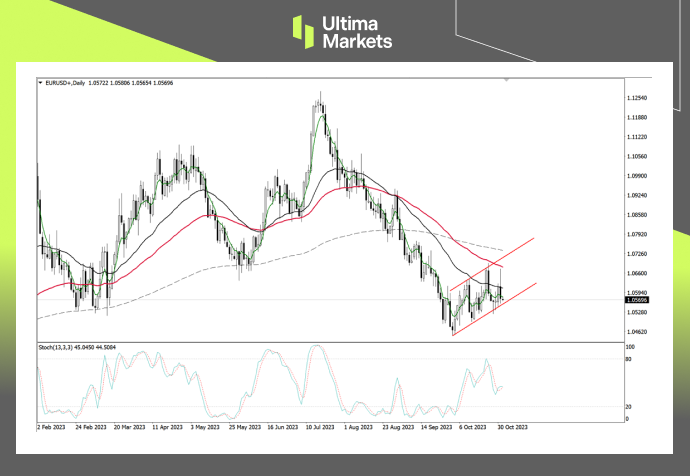
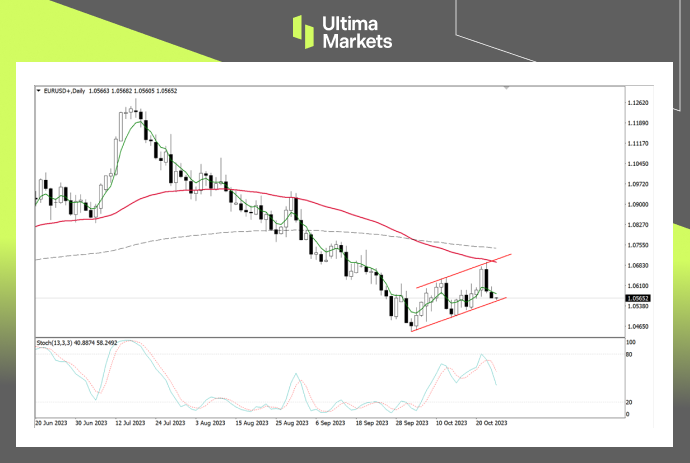
- Stochastic Oscillator: The indicator sent a bull signal above the 50 midline yesterday, suggesting that the exchange rate will start a strong upward trend.
- 65-day moving average: The exchange rate strongly exceeded the 65-day moving average yesterday, and the resistance line converted into a support line. The probability of the Australian dollar continuing to depreciate is low.
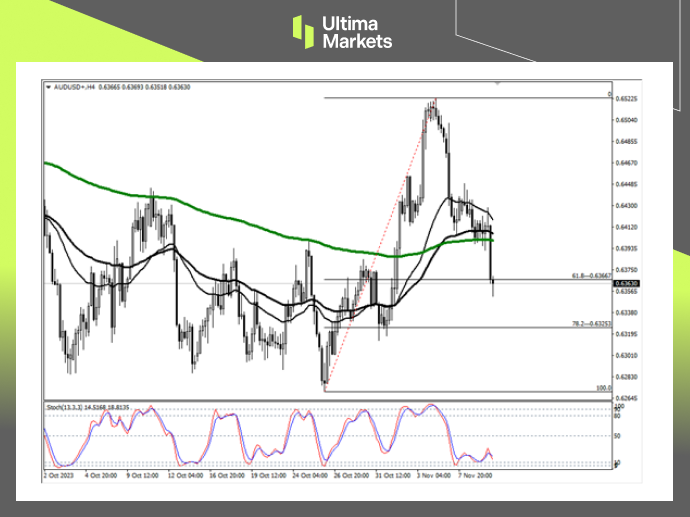
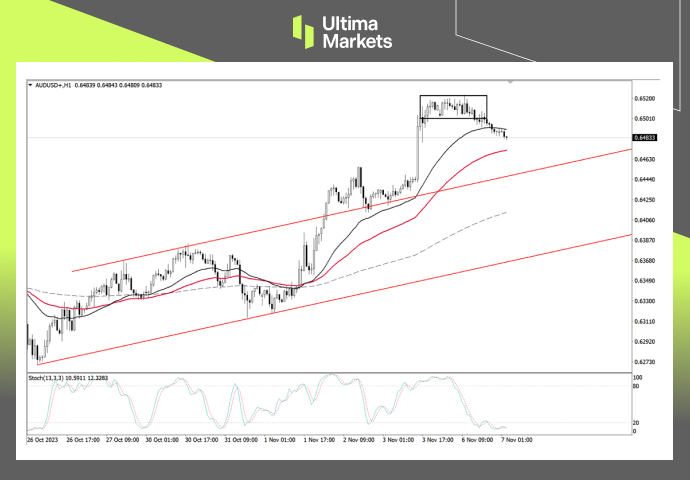
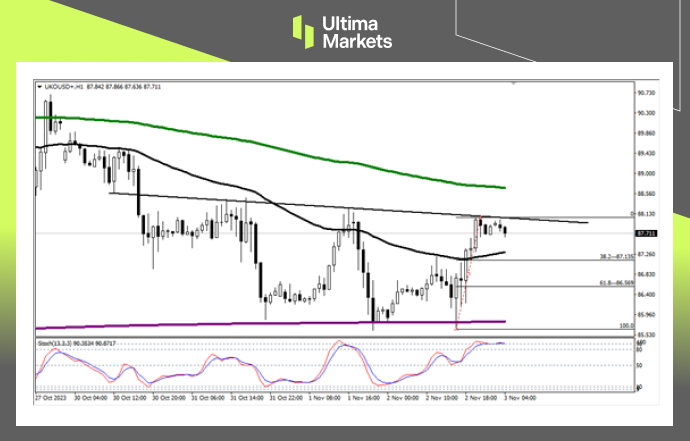
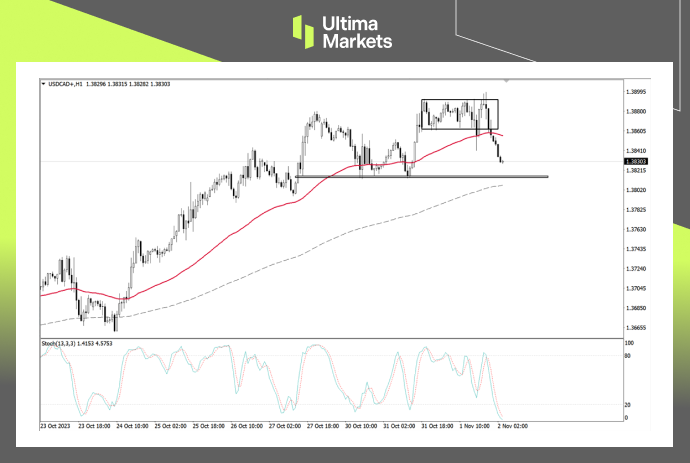
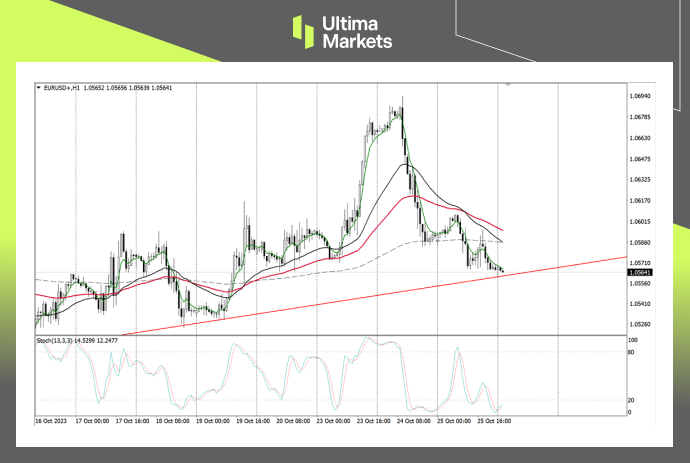
1-hour Chart Analysis
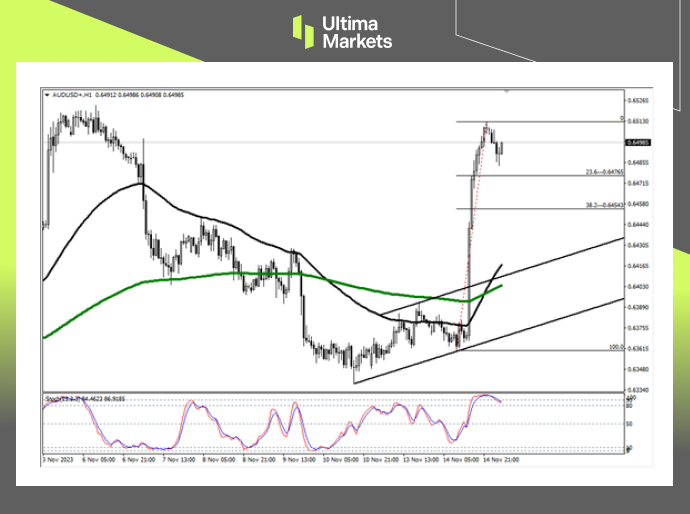
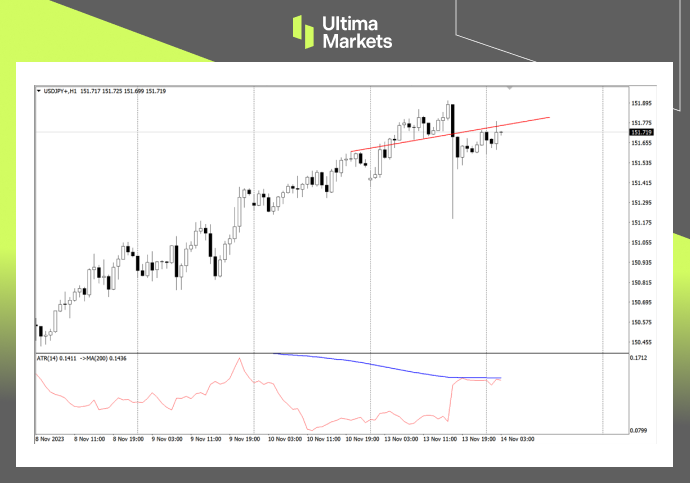
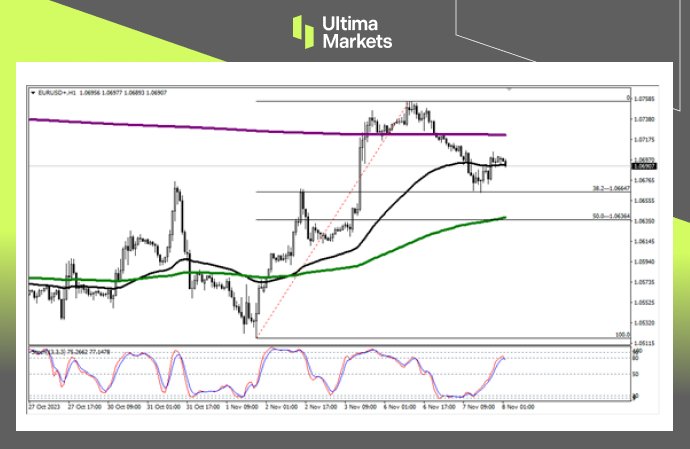
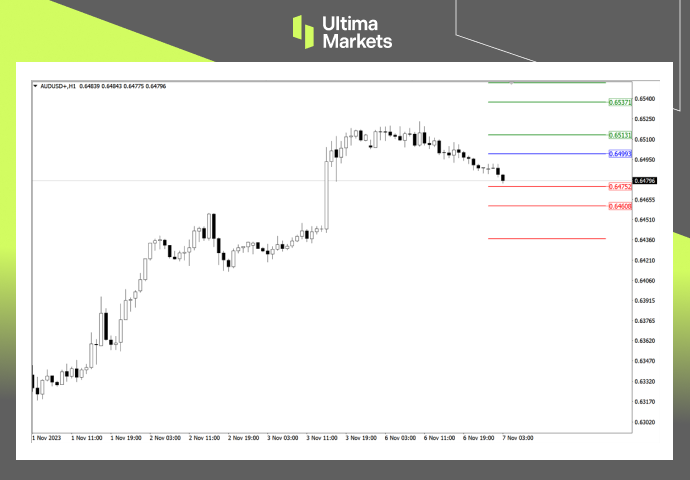
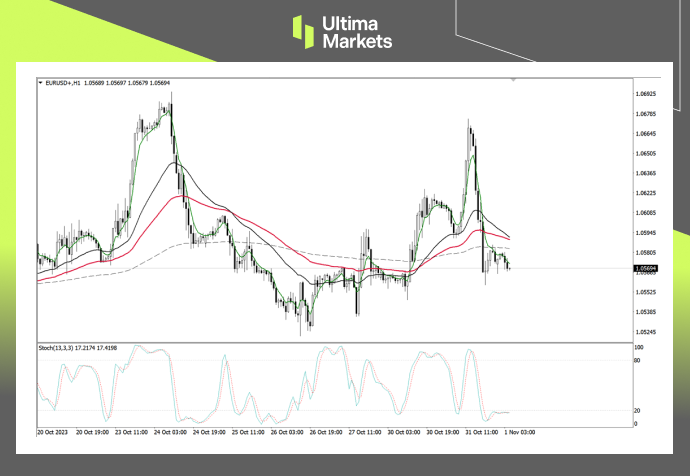
- Stochastic oscillator: The indicator enters the overbought area to form a short signal, suggesting that the subsequent market will enter a correction. Traders should not rush to enter the market chasing high prices, as the profit-loss ratio is inappropriate.
- Fibonacci retracement levels: In a rapidly rising market, the correction usually looks towards the 23.6% and 38.2% Fibonacci retracement levels.
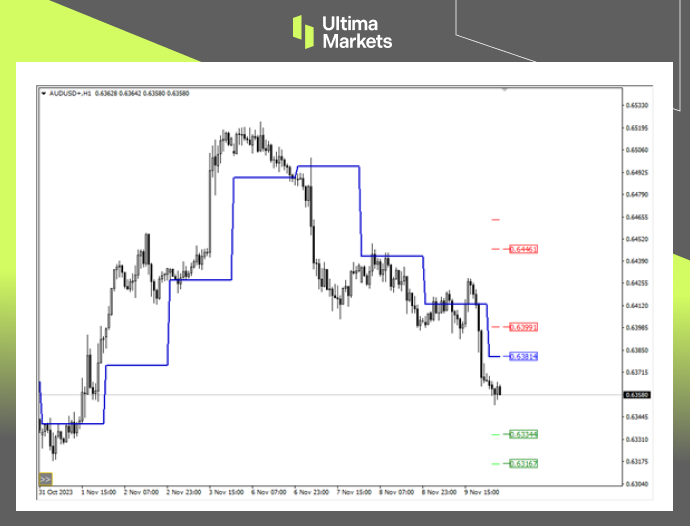
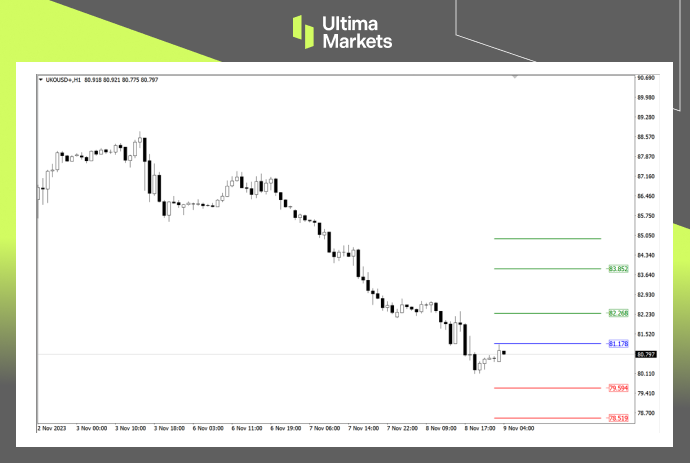
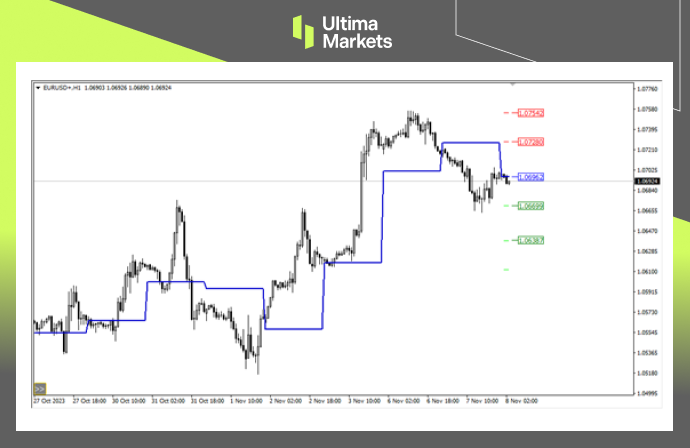
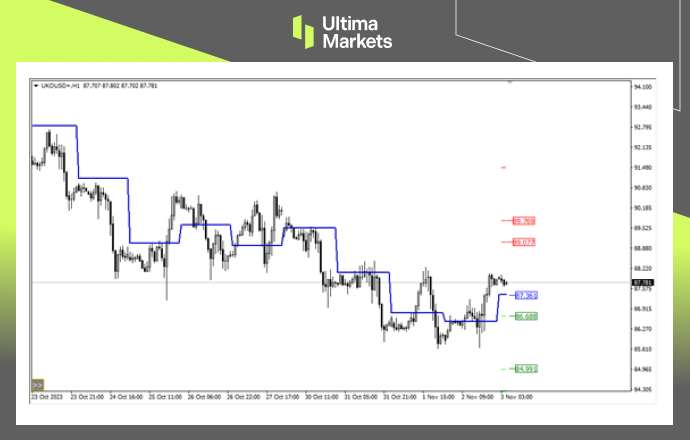
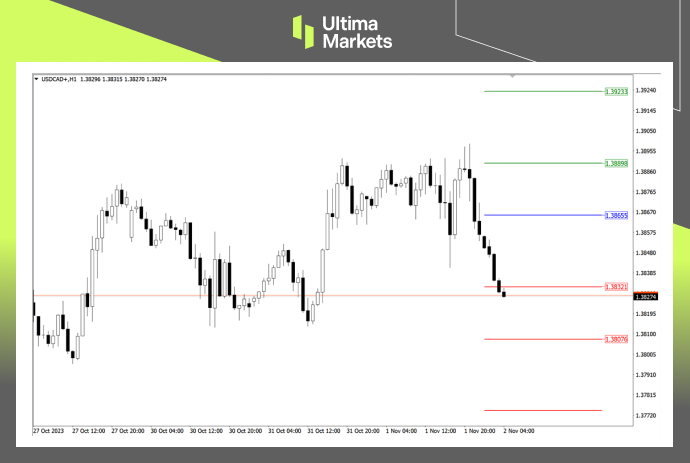
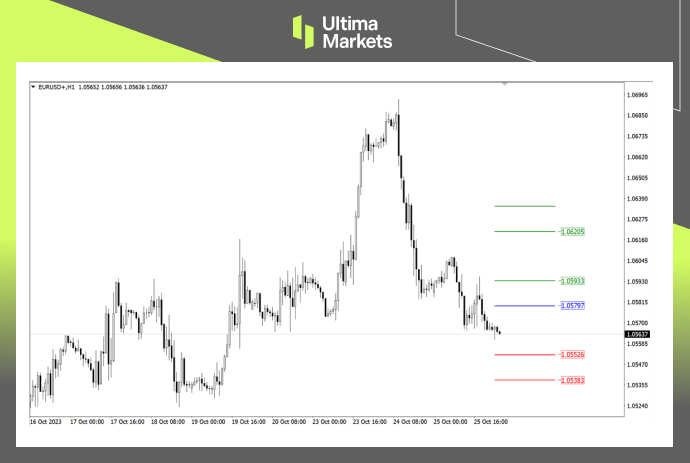
Pivot Indicator
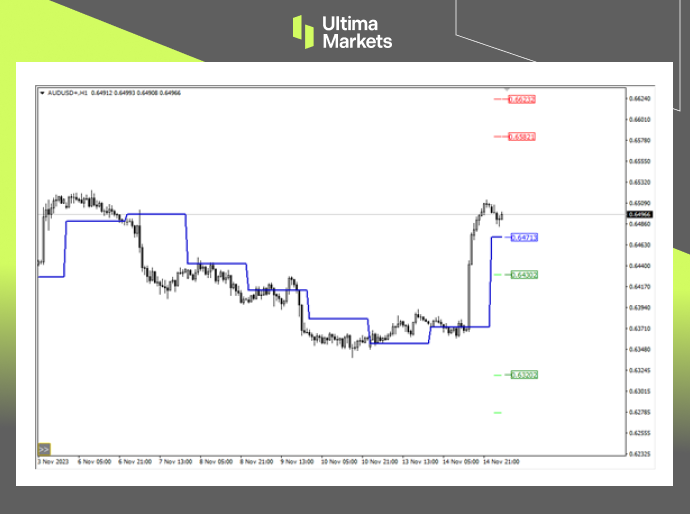
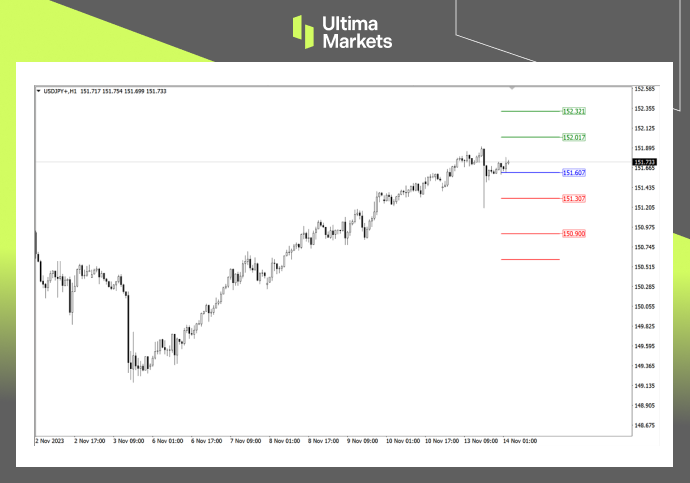
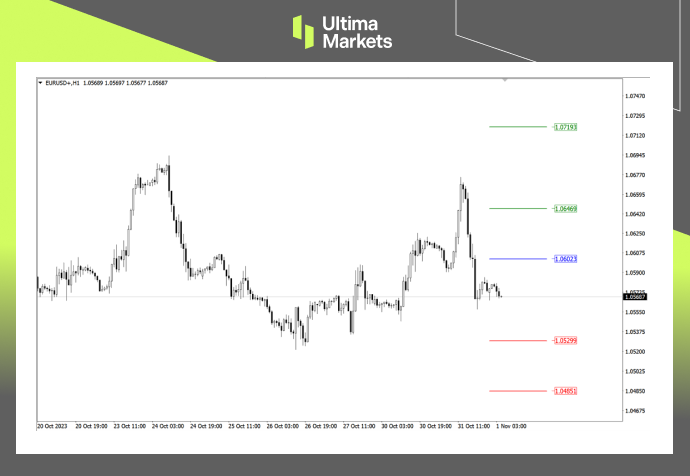
- According to the pivot indicator in Ultima Markets MT4, the central price of the day is established at 0.64713,
- Bullish Scenario: Bullish sentiment prevails above 0.64713, first target 0.65821, second target 0.66232;
- Bearish Outlook: In a bearish scenario below0.64713, first target 0.64302, second target 0.63202.
Conclusion
To navigate the complex world of trading successfully, it’s imperative to stay informed and make data-driven decisions. Ultima Markets remains dedicated to providing you with valuable insights to empower your financial journey.
For personalized guidance tailored to your specific financial situation, please do not hesitate to contact Ultima Markets.
Join Ultima Markets today and access a comprehensive trading ecosystem equipped with the tools and knowledge needed to thrive in the financial markets.
Stay tuned for more updates and analyses from our team of experts at Ultima Markets.
—–
Legal Documents
Ultima Markets, a trading name of Ultima Markets Ltd, is authorized and regulated by the Financial Services Commission “FSC” of Mauritius as an Investment Dealer (Full-Service Dealer, excluding Underwriting) (license No. GB 23201593). The registered office address: 2nd Floor, The Catalyst, 40 Silicon Avenue, Ebene Cybercity, 72201, Mauritius.
Copyright © 2023 Ultima Markets Ltd. All rights reserved.
Disclaimer
Comments, news, research, analysis, price, and all information contained in the article only serve as general information for readers and do not suggest any advice. Ultima Markets has taken reasonable measures to provide up-to-date information, but cannot guarantee accuracy, and may modify without notice. Ultima Markets will not be responsible for any loss incurred due to the application of the information provided.