Comprehensive USDX Analysis for October 6, 2023
In this comprehensive analysis, Ultima Markets brings you an insightful breakdown of the USDX for 6th October 2023.
The Core: Fundamental Factors
- ADP Employment Data: Recent ADP employment data showed a significant drop below expectations. This is a crucial indicator of labor market dynamics.
- Historically Low Jobless Claims: The announcement of 207,000 initial jobless claims last week, still at a historical low, underscores the robustness of the job market.
- Fewest Quarterly Layoffs: U.S. companies have reported the fewest quarterly layoffs in a year due to strong seasonal hiring plans. This is a significant positive signal for the economy.
The Turning Point: Interest Rates
The above factors collectively raise questions about the possibility of interest rate adjustments in the near future. The final decision hinges on the impending release of US non-farm employment data, due tonight. This data will be pivotal in shaping the USDX’s trajectory.
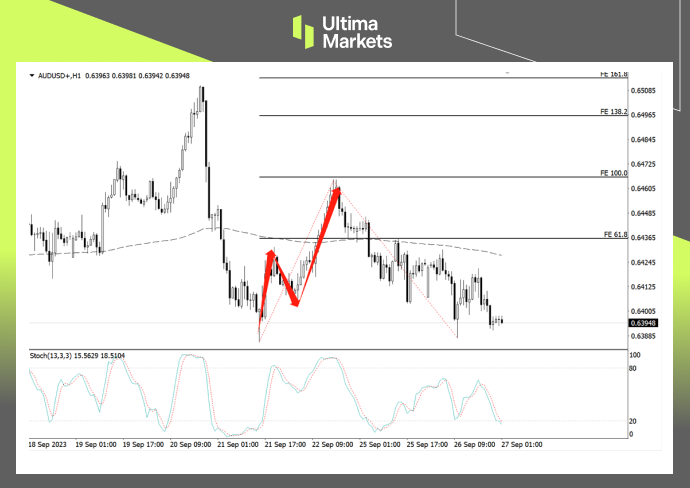
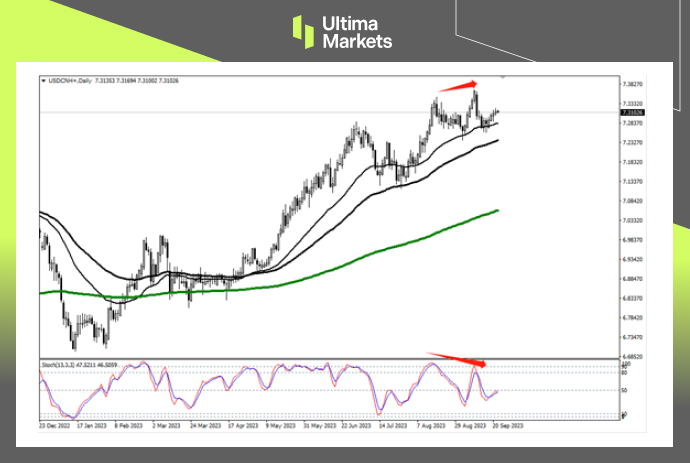
The Technical Aspect: USDX Trends
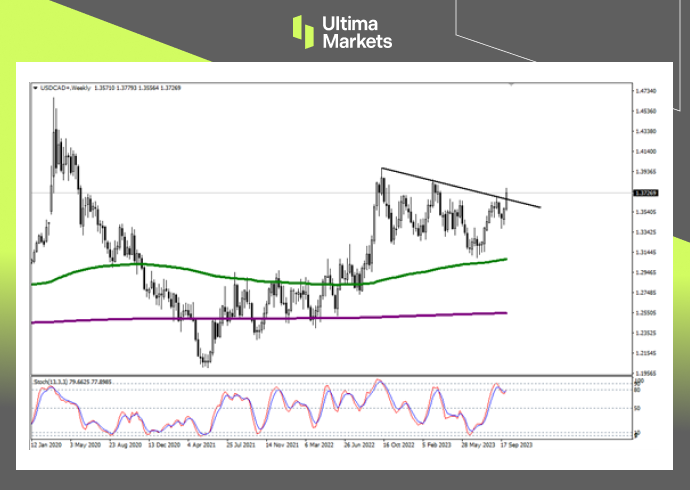
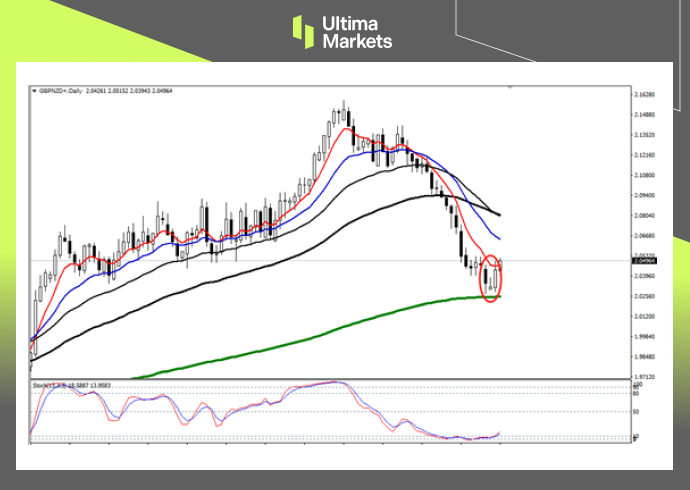
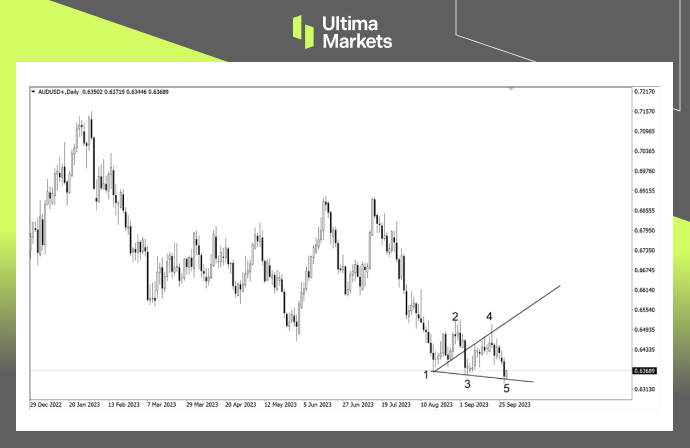
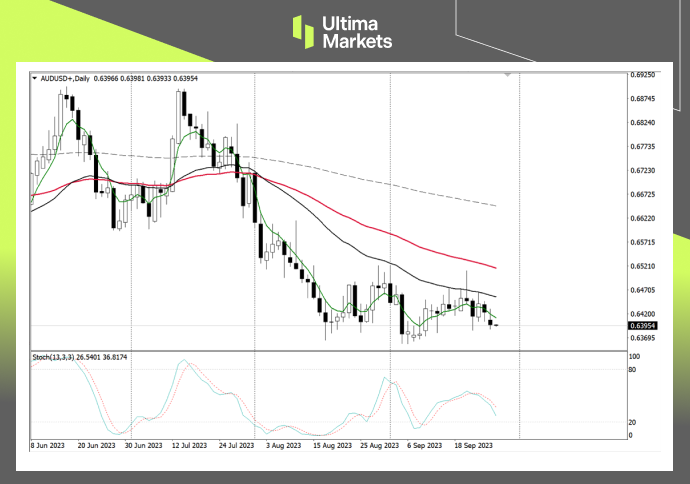
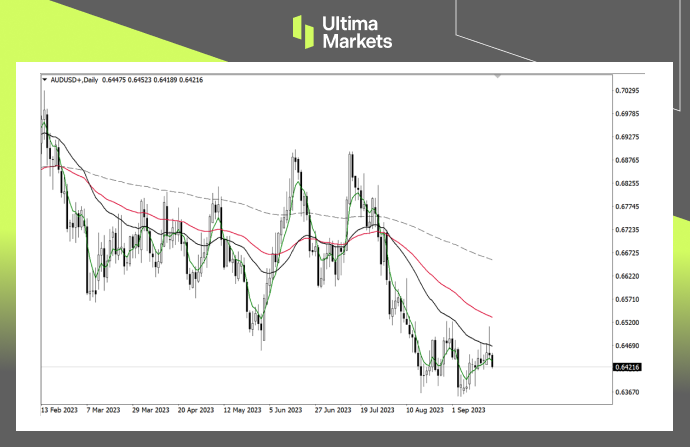
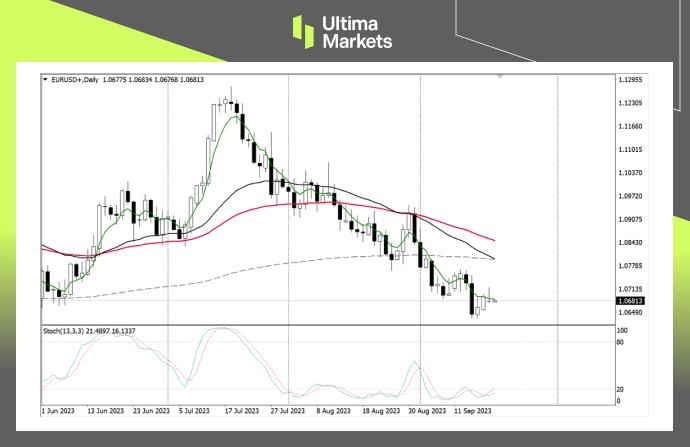
- Daily Chart Trends: On the daily chart, the US dollar index has experienced a two-day decline. The stochastic oscillator’s dead cross in the overbought area suggests a short-term downtrend.
- Bearish Trend: To confirm a bear trend, it’s crucial for the USDX to break effectively below its recent lows. The initial target rests near the blue 17-day moving average.
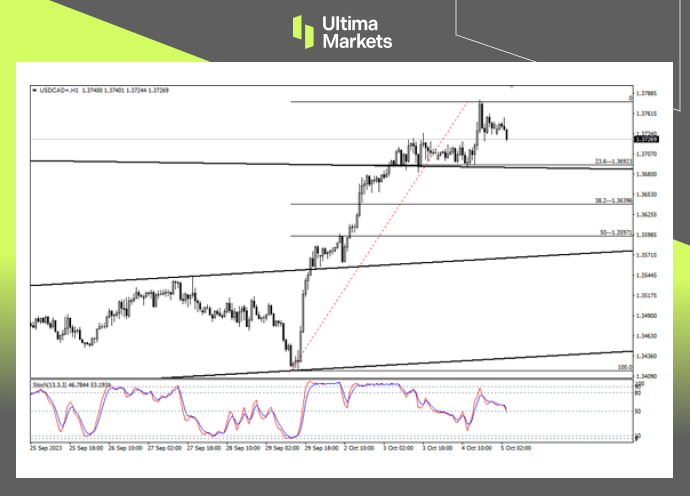
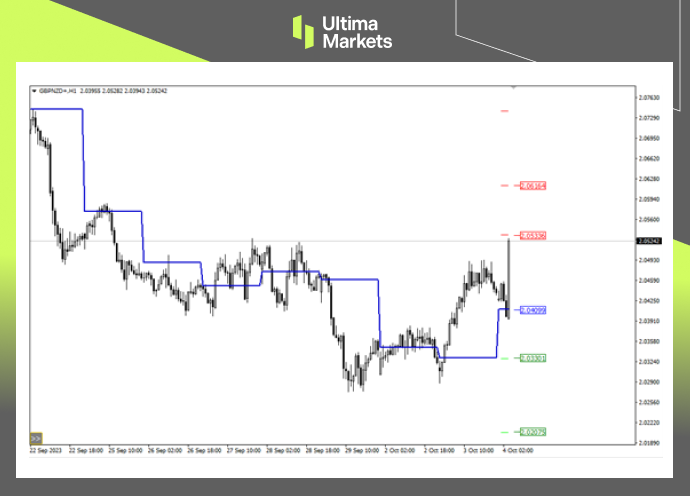
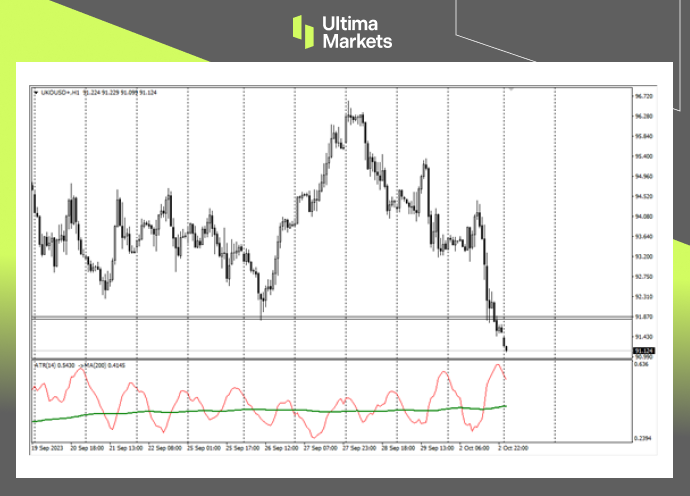
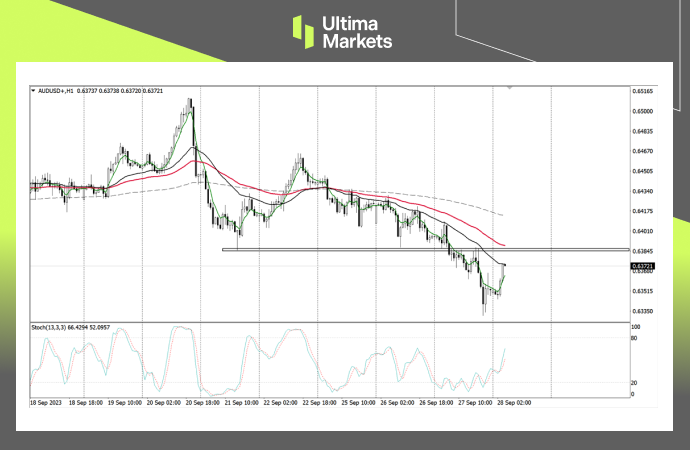
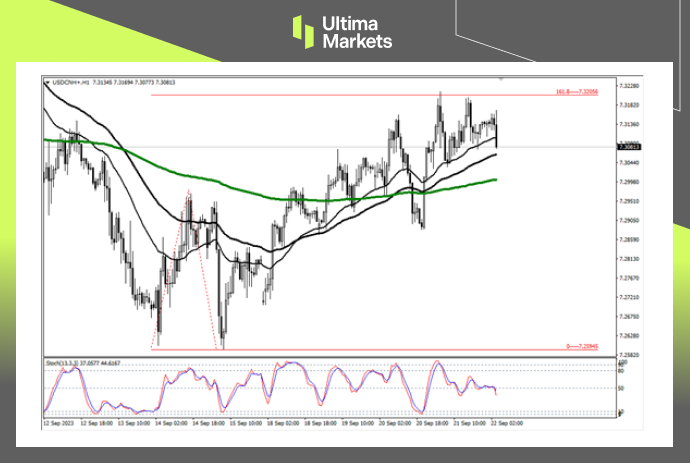
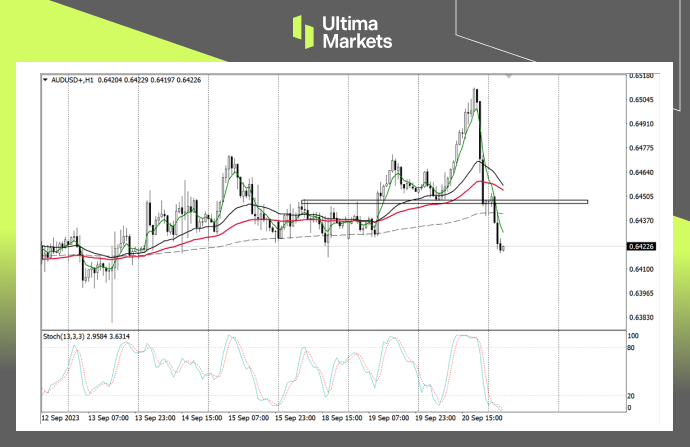
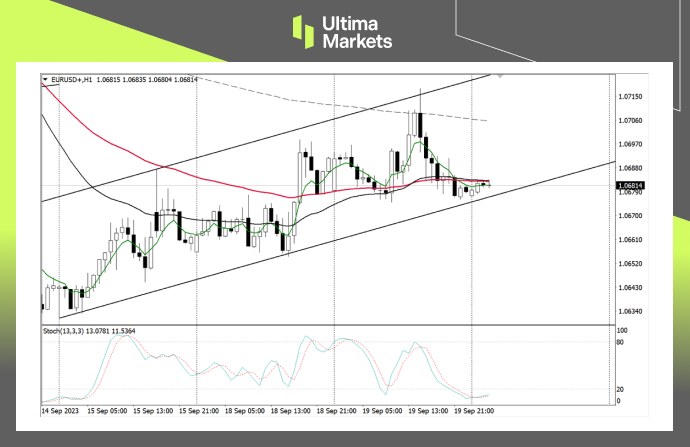
- Hourly Chart Insights: On the hourly chart, the market has breached the support level around 106.23. The ATR combination indicator confirms this breakdown.
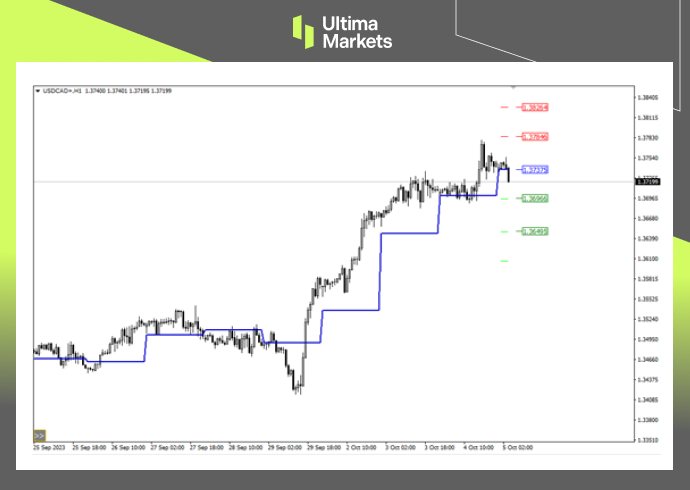
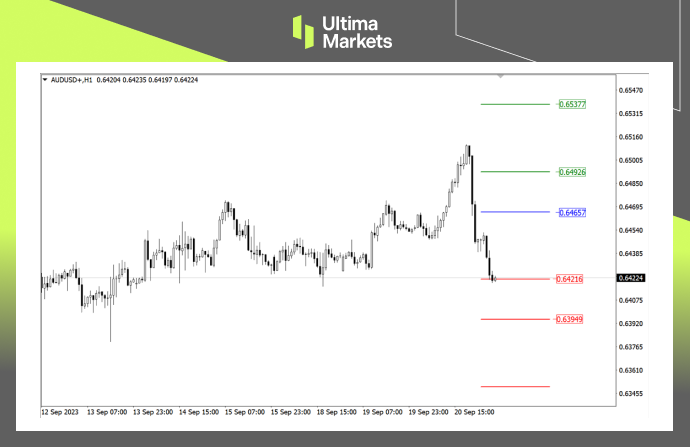
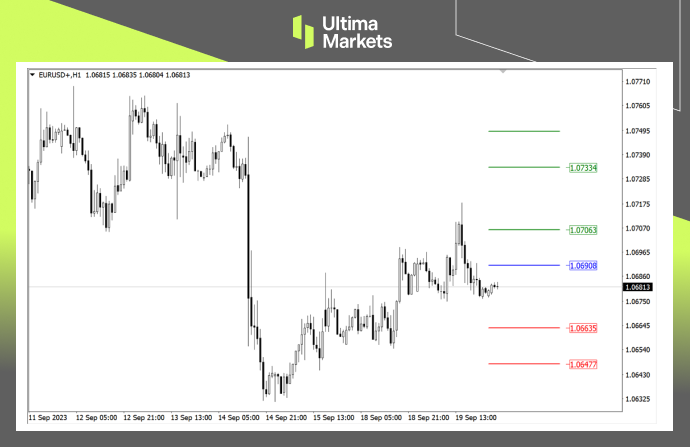
- Pivot Indicator: As per Ultima Markets’ pivot indicator, the central price for the day is 106.200.
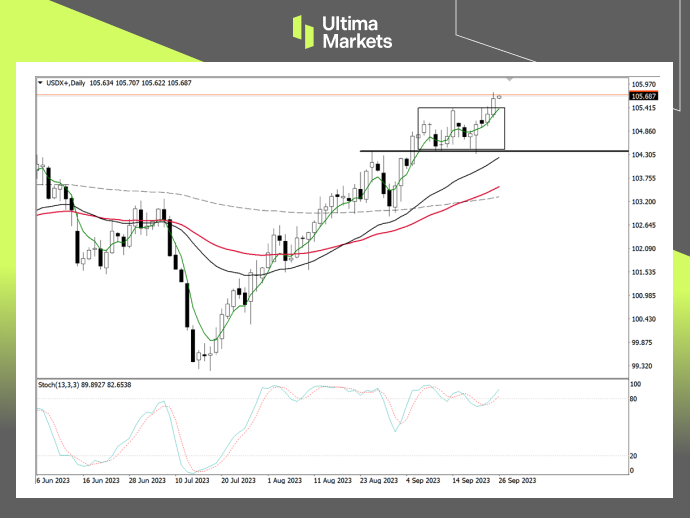
Daily chart of USDX
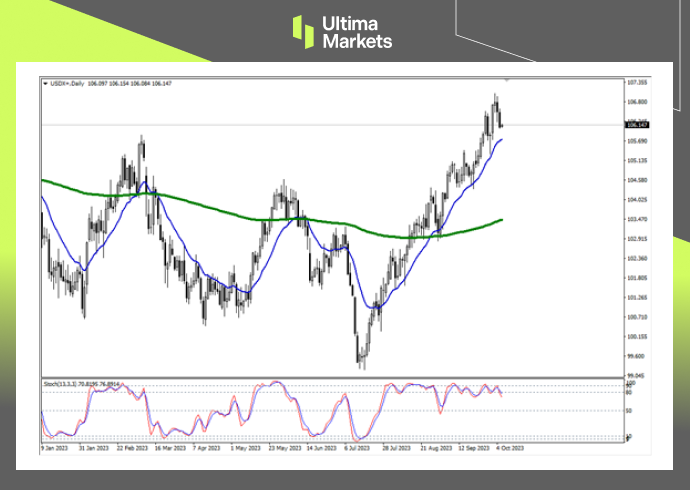
(Daily chart of USDX, source: Ultima Markets MT4)
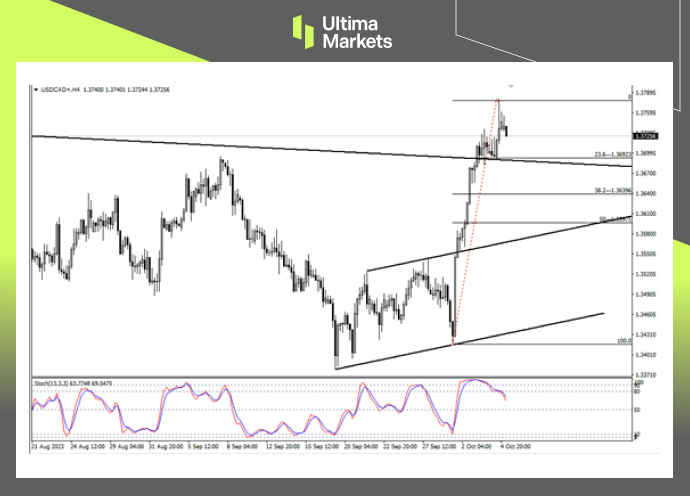
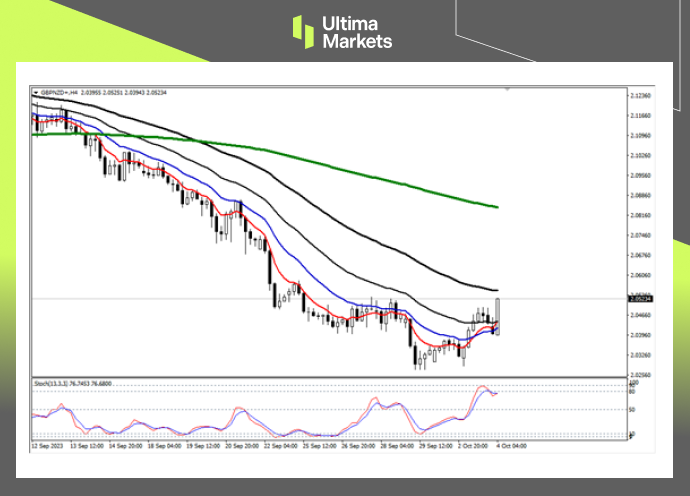
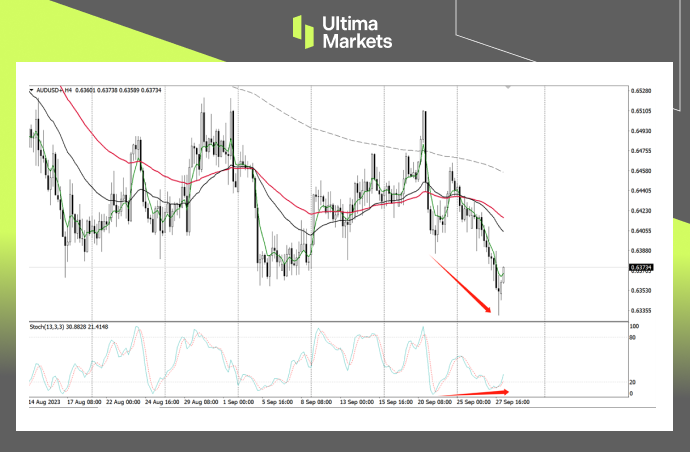
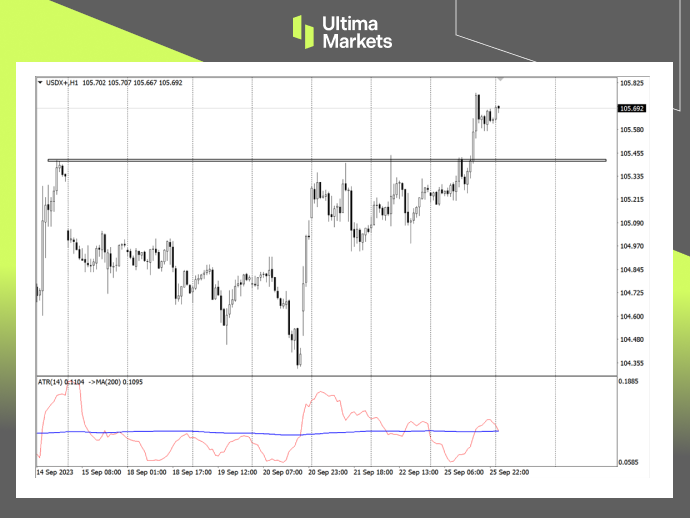
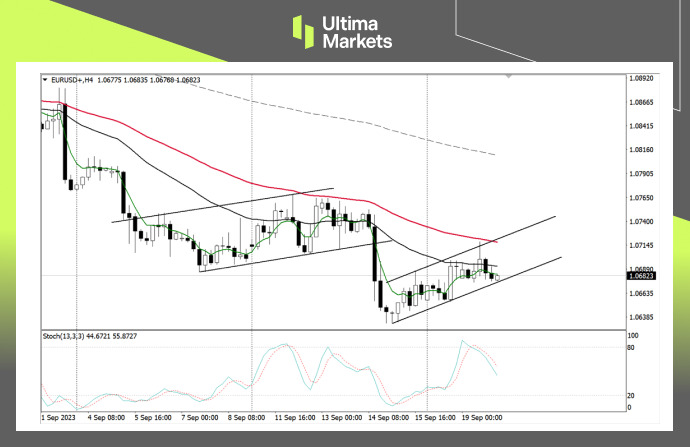
1-hour chart of USDX
Although it has increased the probability of a bear trend, it still needs to wait for the U.S. dollar index to effectively fall below the lowest price. The price may be relatively limited. The first target is near the blue 17-day moving average.
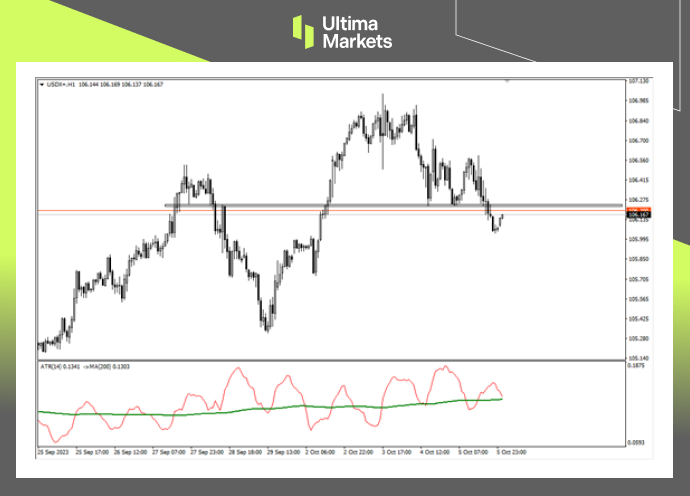
(1-hour chart of USDX, source: Ultima Markets MT4)
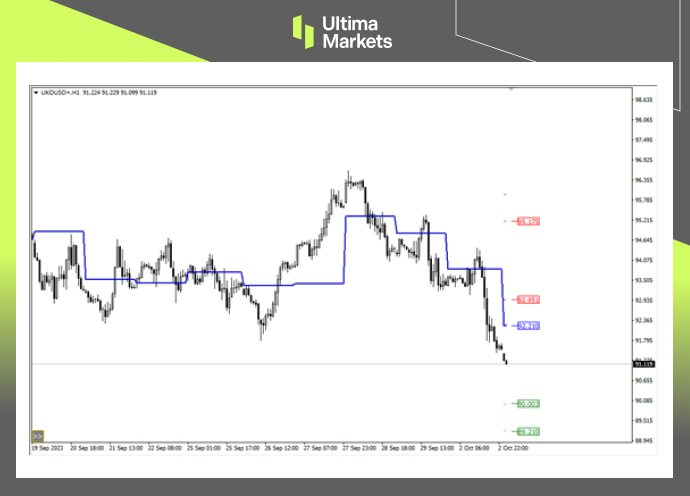
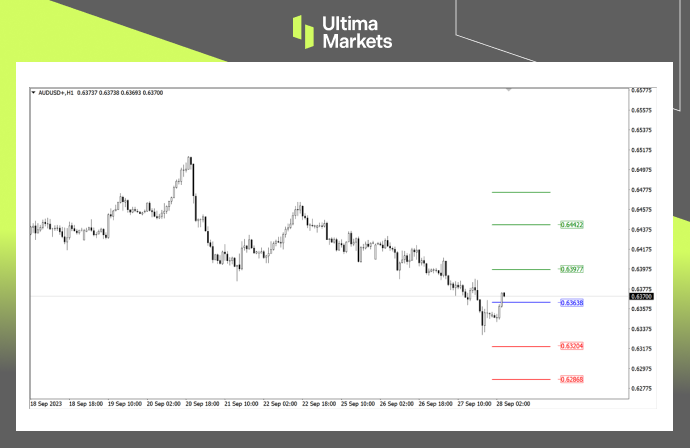
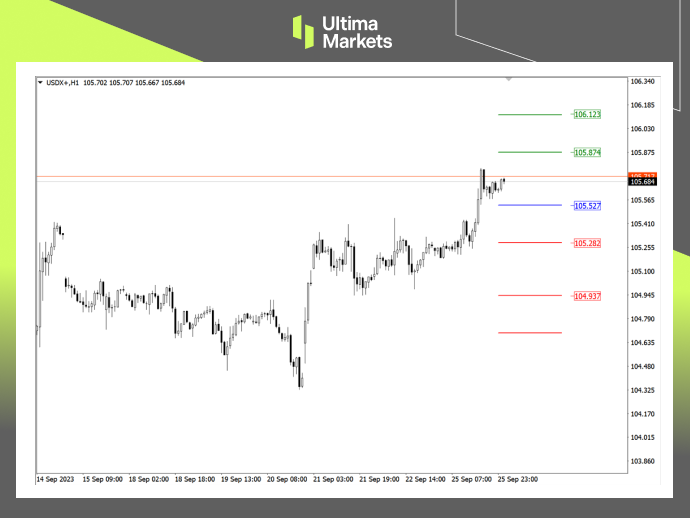
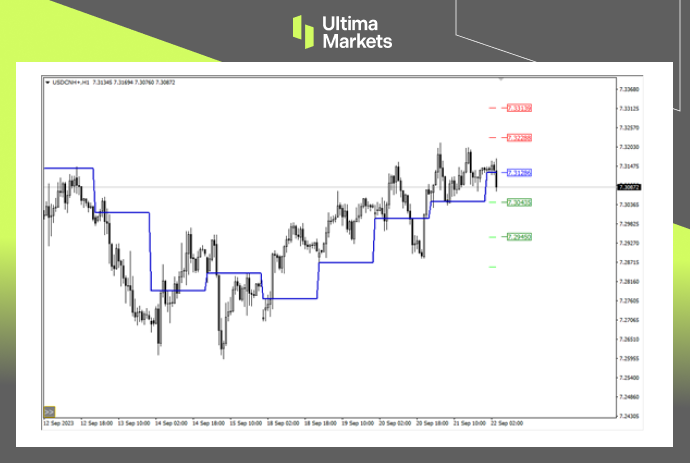
Pivot Indicators
On the 1-hour chart, the market fell below the support level around 106.23, and the ATR combination indicator hinted at the effectiveness of the breakdown. Waiting for the price to retreat and see if there is any chance of further downward movement.
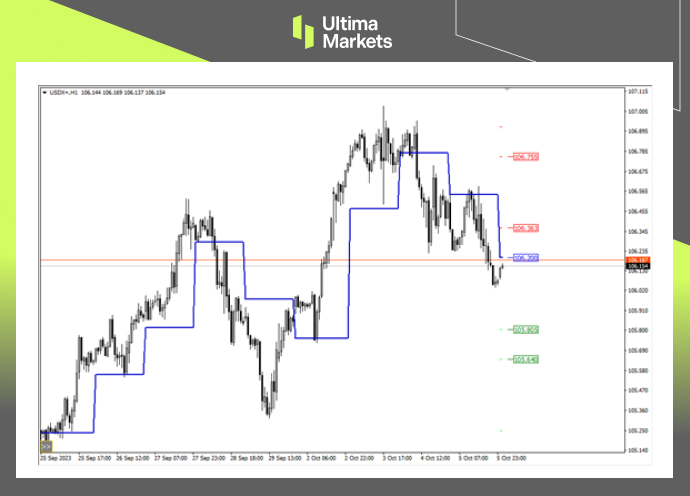
(Pivot Indicators for USDX, source: Ultima Markets MT4)
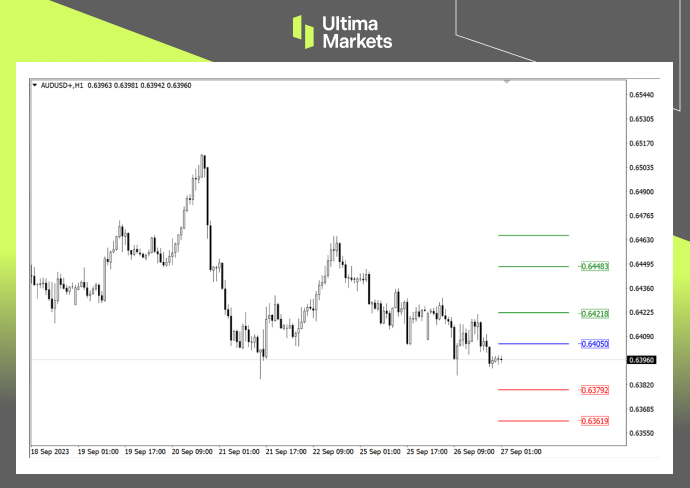
Potential Scenarios
According to the pivot indicator in Ultima Markets MT4, the central price of the day is 106.200.
- Bullish Above 106.200: If the USDX remains above 106.200, the first target is 106.363, with a secondary target at 106.755.
- Bearish Below 106.200: In case the USDX dips below 106.200, the initial target is 105.805, with a secondary target at 105.640.
Legal Documents
Ultima Markets, a trading name of Ultima Markets Ltd, is authorized and regulated by the Financial Services Commission “FSC” of Mauritius as an Investment Dealer (Full-Service Dealer, excluding Underwriting) (license No. GB 23201593). The registered office address: 2nd Floor, The Catalyst, 40 Silicon Avenue, Ebene Cybercity, 72201, Mauritius.
Disclaimer
Comments, news, research, analysis, price, and all information contained in the article only serve as general information for readers and do not suggest any advice. Ultima Markets has taken reasonable measures to provide up-to-date information, but cannot guarantee accuracy, and may modify without notice. Ultima Markets will not be responsible for any loss incurred due to the application of the information provided.
Copyright © 2023 Ultima Markets Ltd. All rights reserved.