Focus on XAU/USD today.
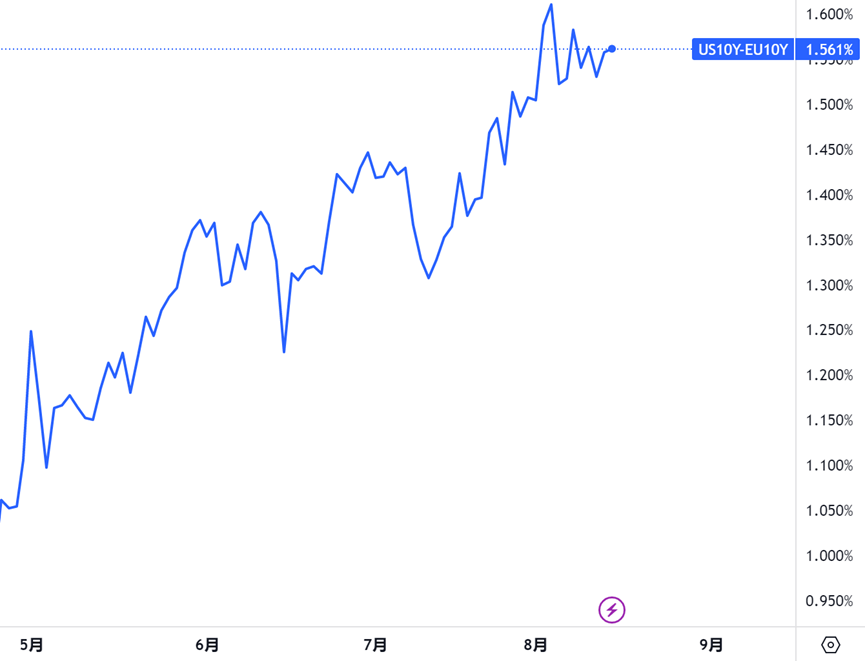
Fundamentally, there has been a large divergence between China’s domestic gold prices and international gold prices recently, but the bullish drive for domestic gold is mostly due to the depreciation of the local currency and the impact of restrictions on gold imports. It is difficult for international gold prices to be driven by this, but as the monetary policies of various countries come to an end, in line with expectations of falling inflation and economic downturn, international gold prices have certain upward momentum. At present, the market still needs a stimulus to allow gold prices to start a long-term bull trend again.
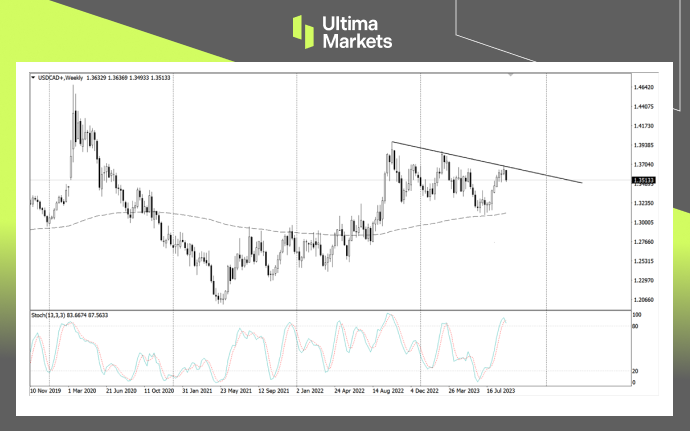
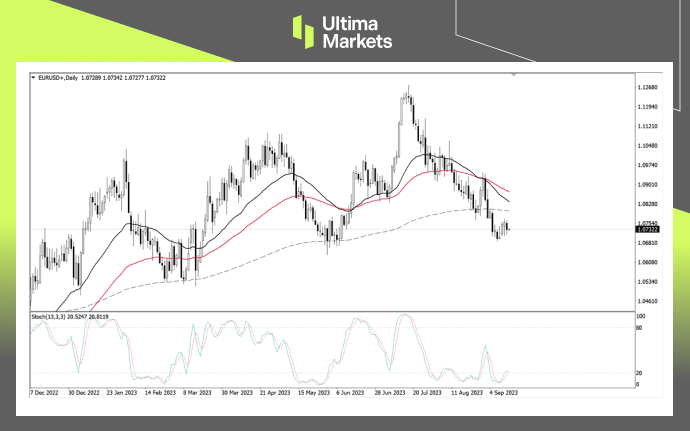
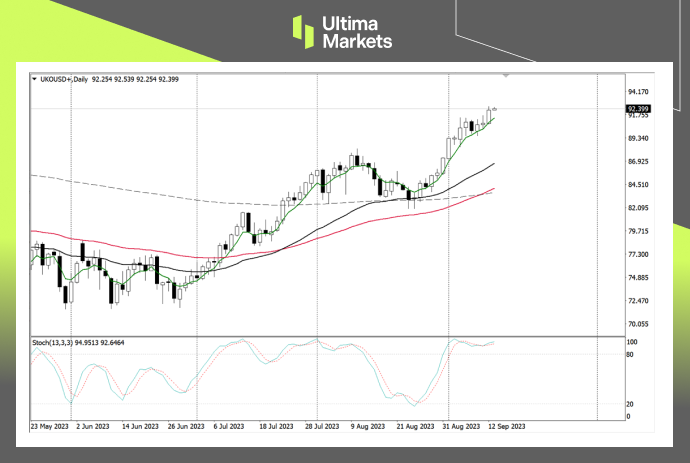
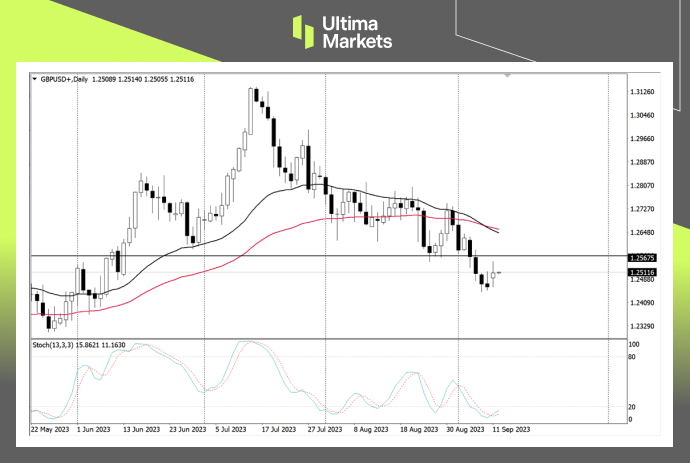
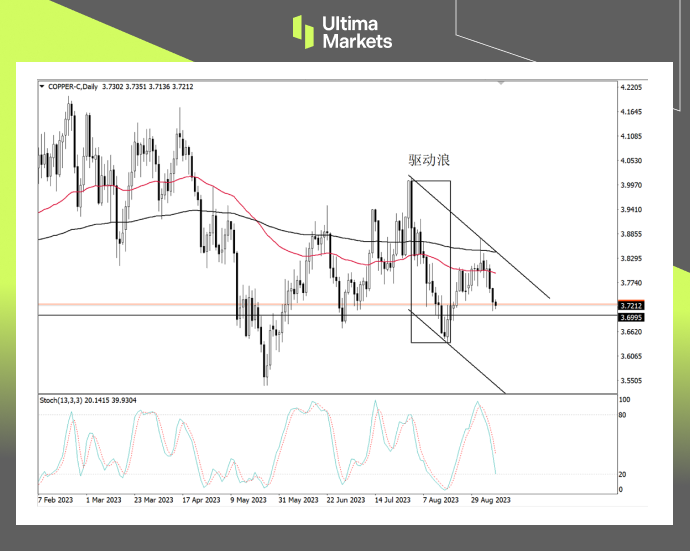
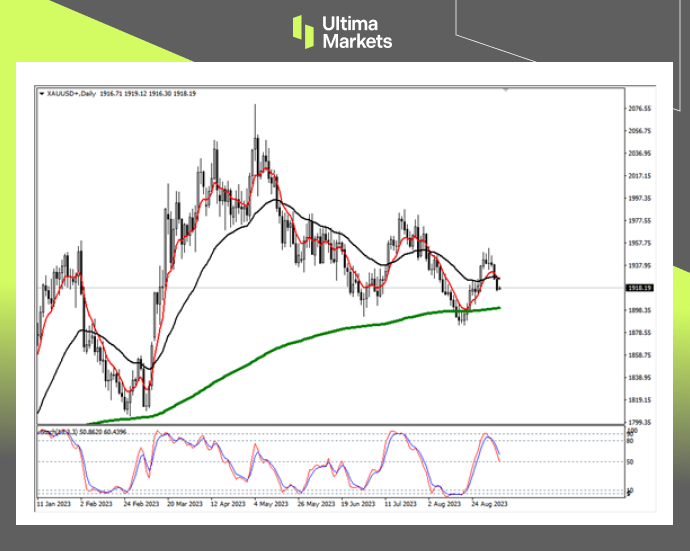
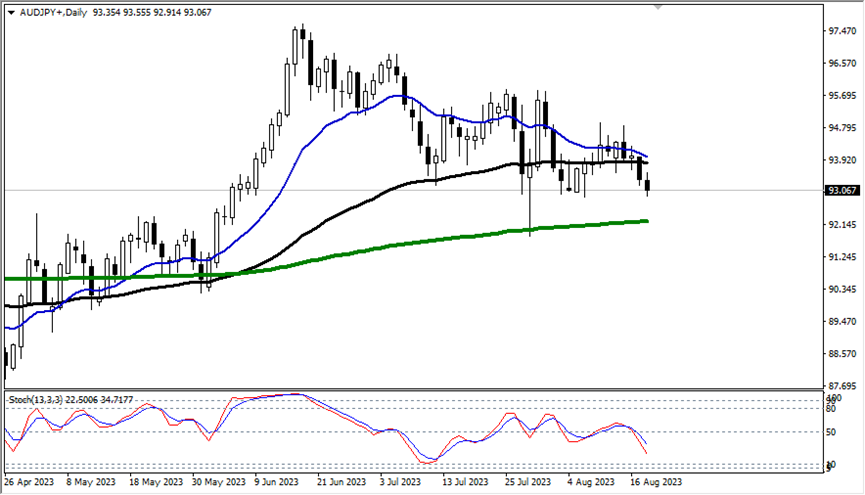
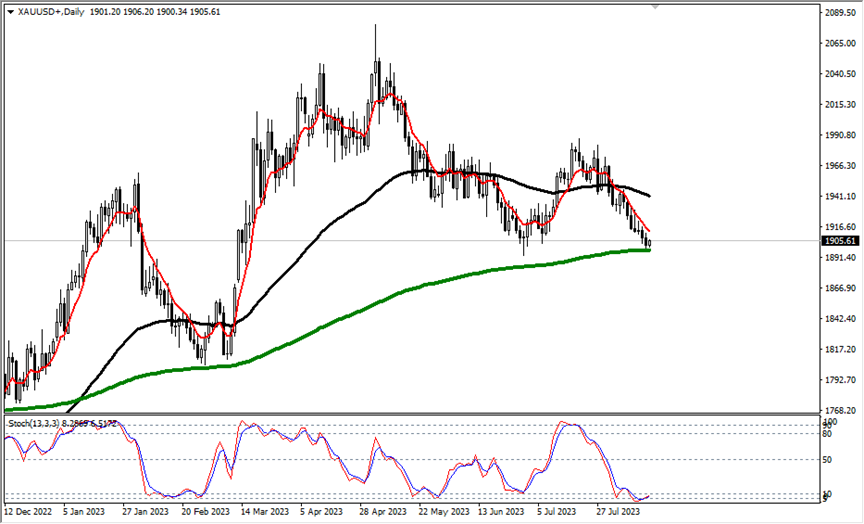
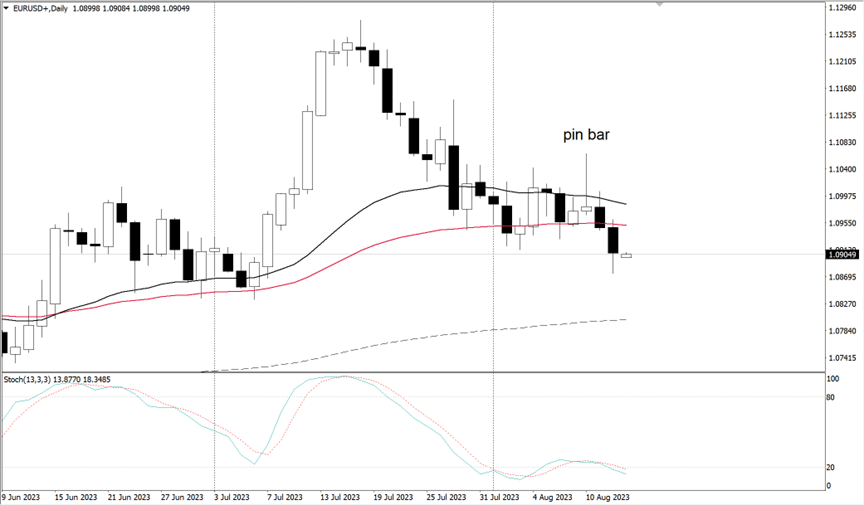
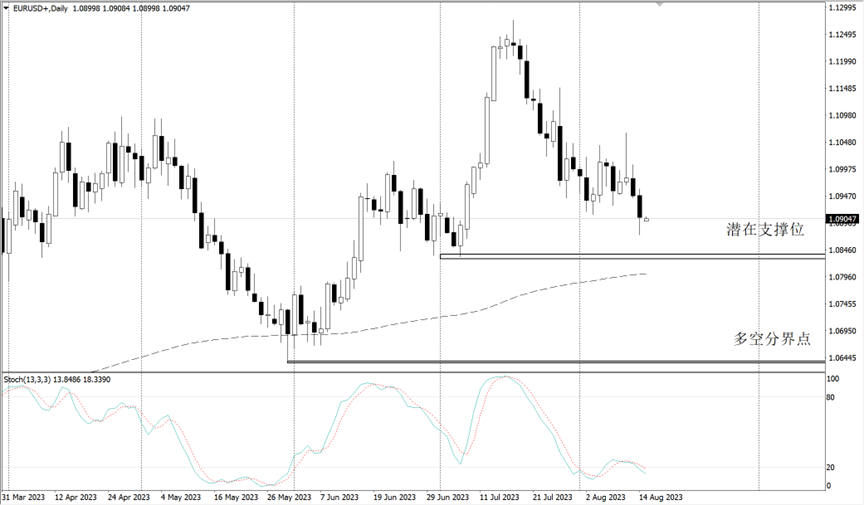
Technically, the cross of the stochastic oscillator on the gold daily chart has been established, suggesting the arrival of a bullish trend.
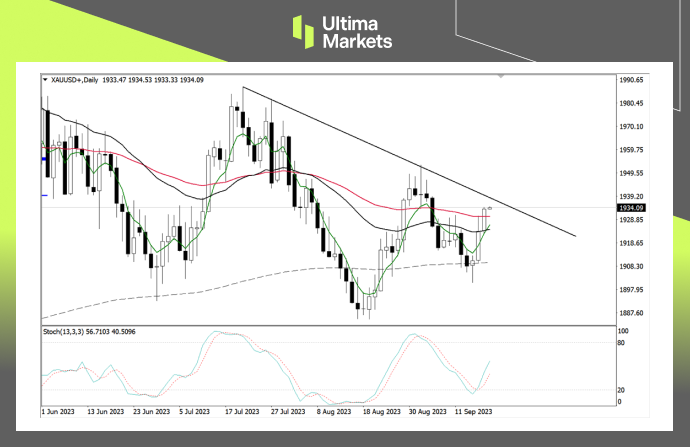
( Daily chart of XAU/USD, source: Ultima Markets MT4)
The market has ushered in a rebound trend since it hit the 200-day moving average last Thursday. However, it is worth noting that the top is about to hit the downward trend line, and the remaining rebound space is relatively narrow.
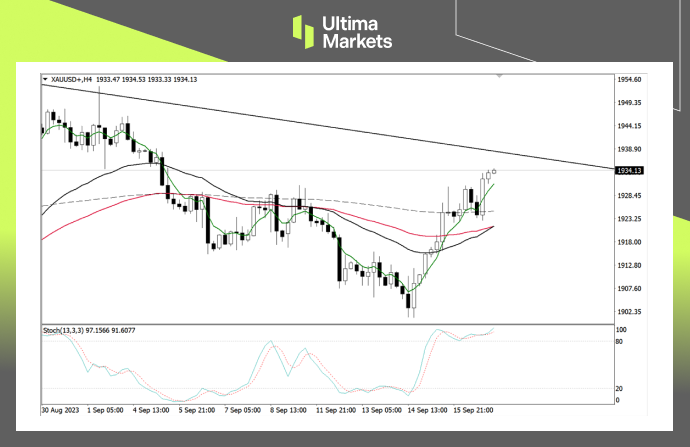
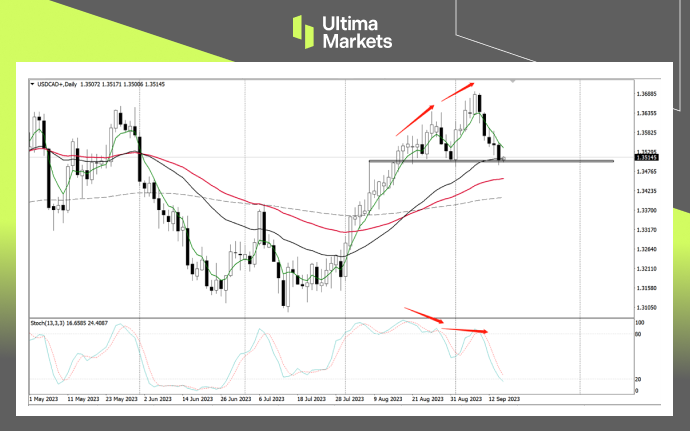
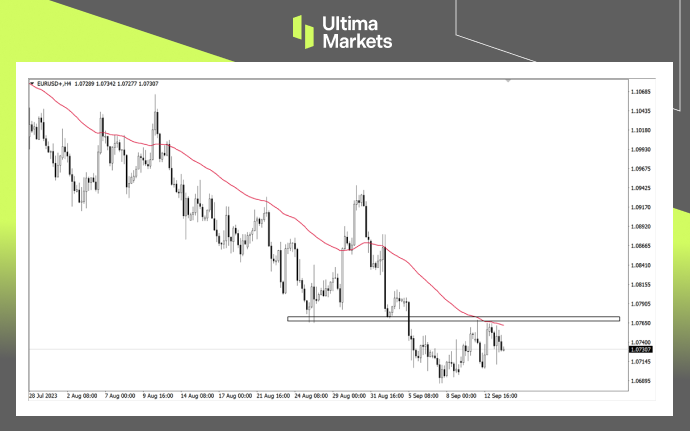
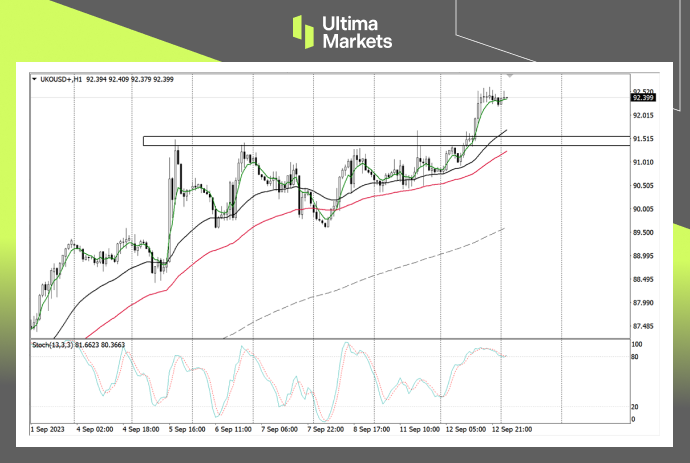
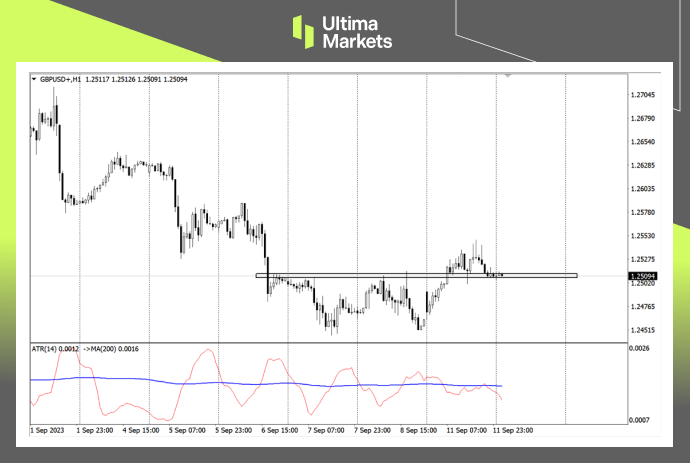
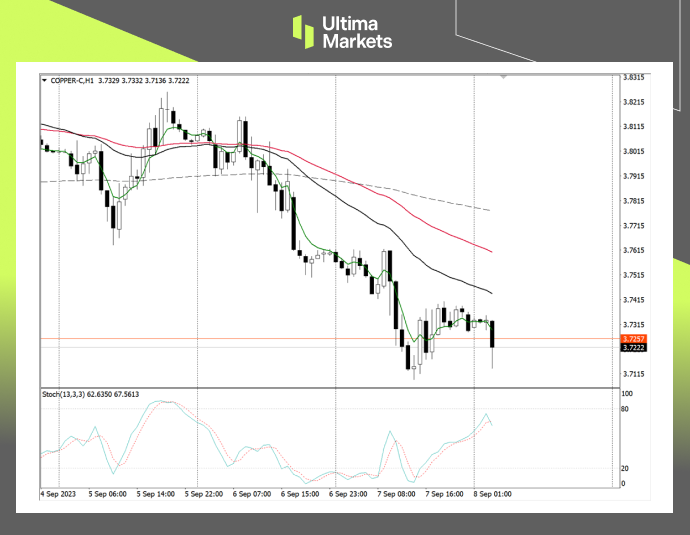
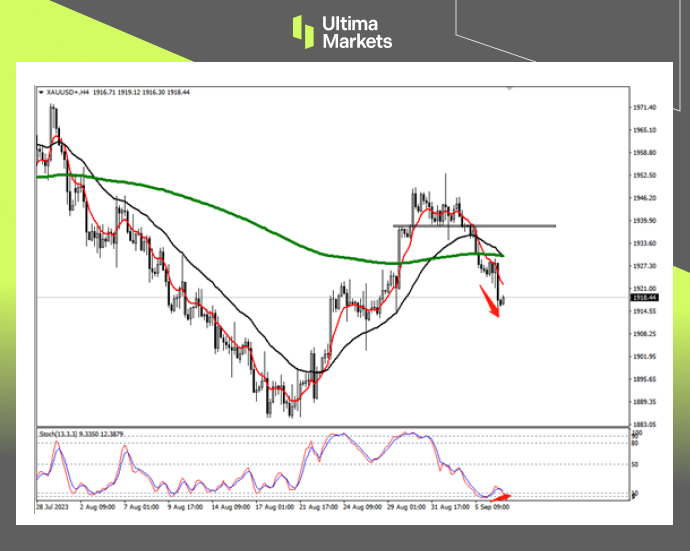
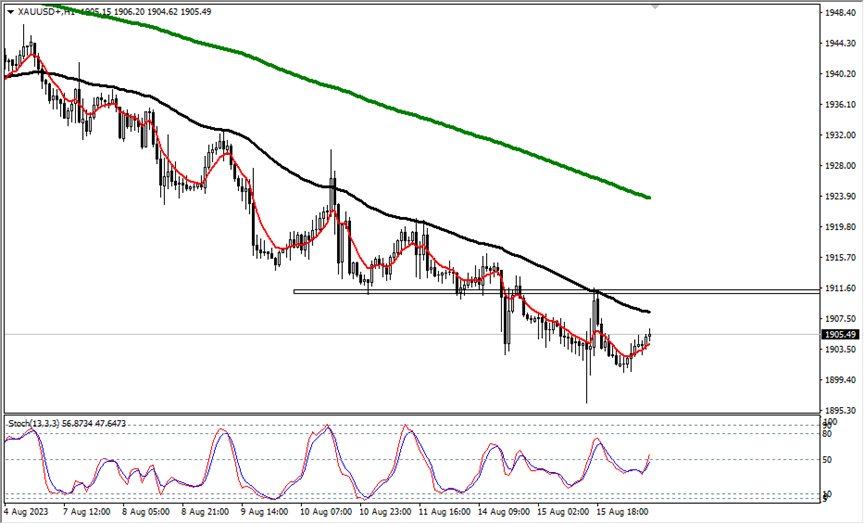
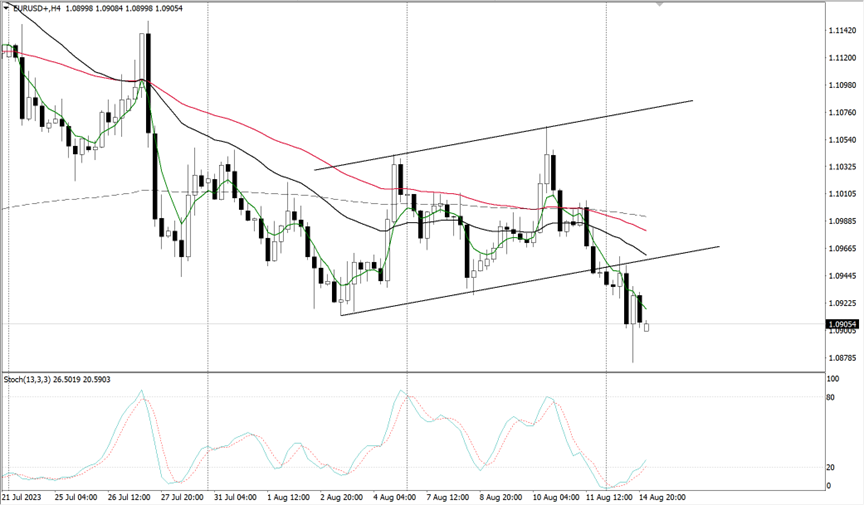
(4-hour chart of XAU/USD, source: Ultima Markets MT4)
On the 4-hour chart, the stochastic oscillator has entered the overbought zone, suggesting that potential gold bulls may be blocked. However, judging from the chart, after the market hit the 200-period moving average, the large entity of candle bar broke through the consolidation range since last Friday, and there is a high probability that the bullish trend will continue in the Asian session.
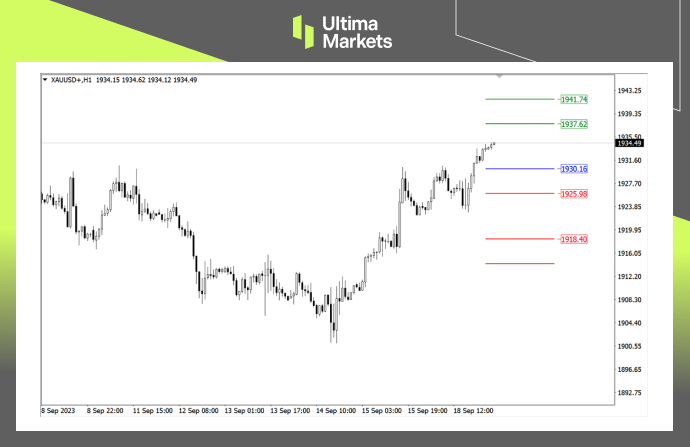
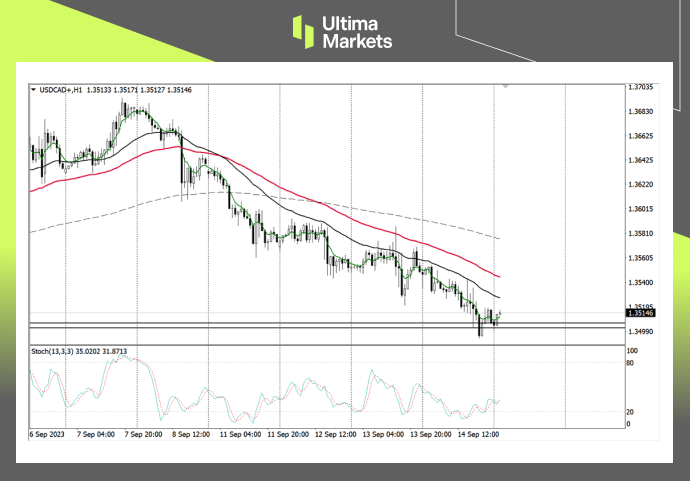
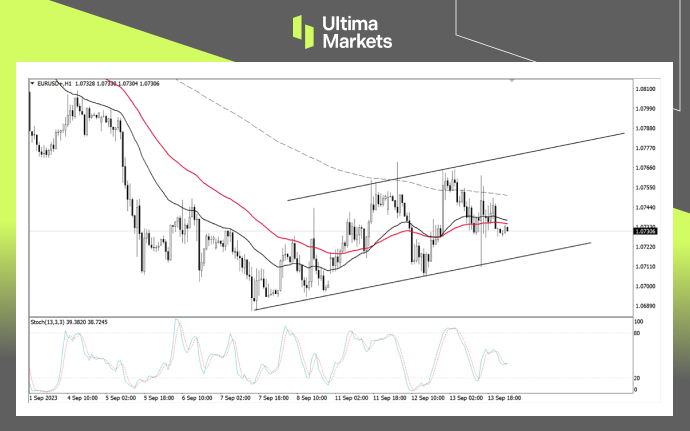
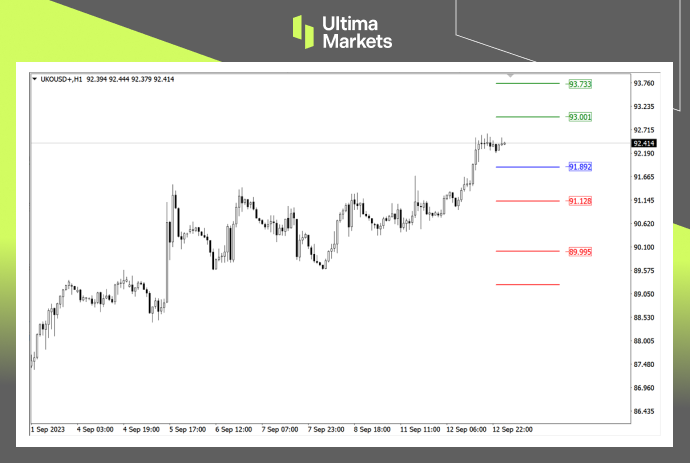
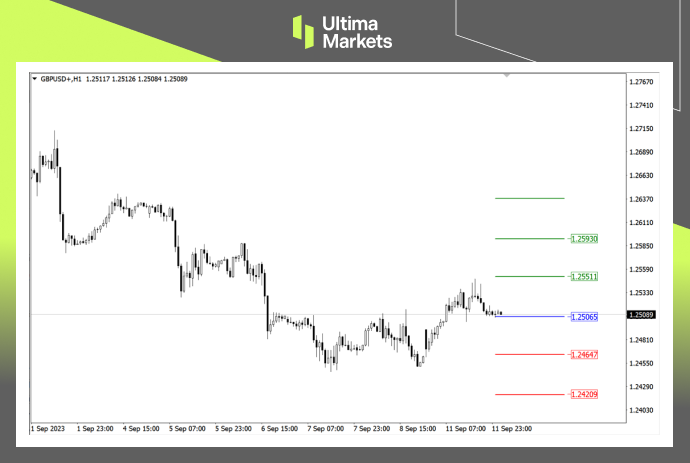
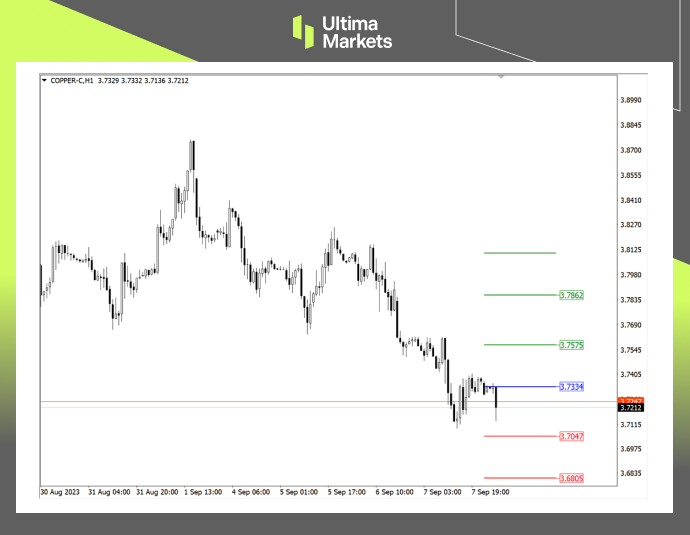
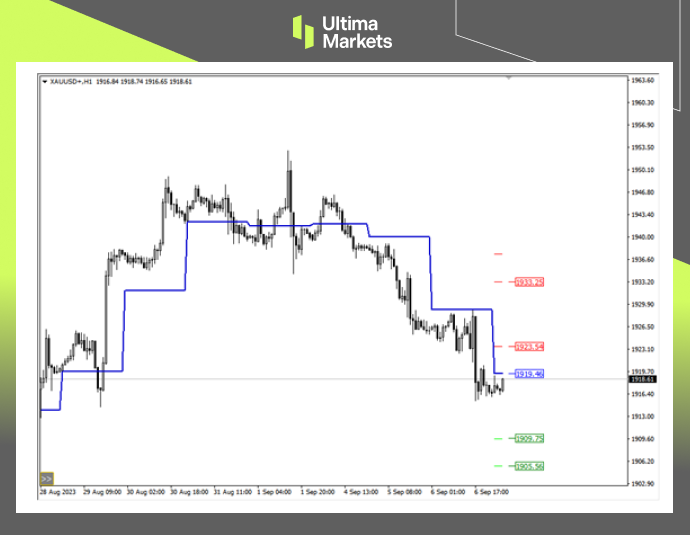
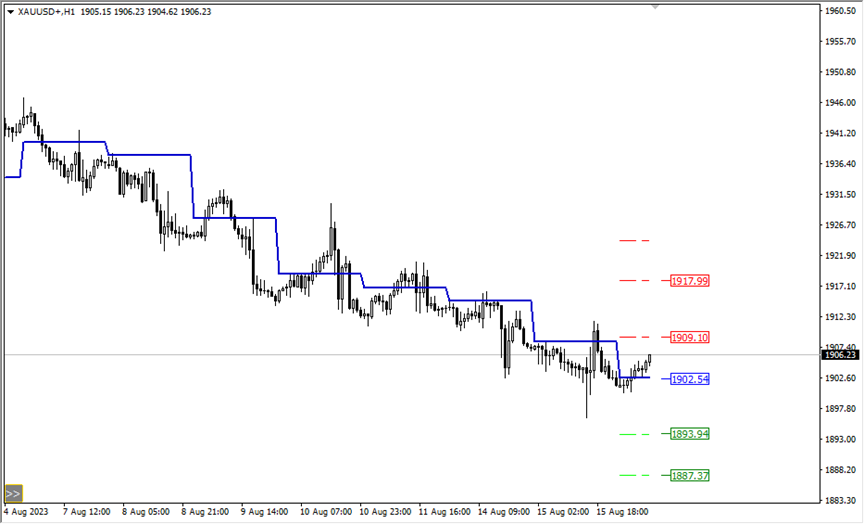
(1-hour chart of XAU/USD, source: Ultima Markets MT4)
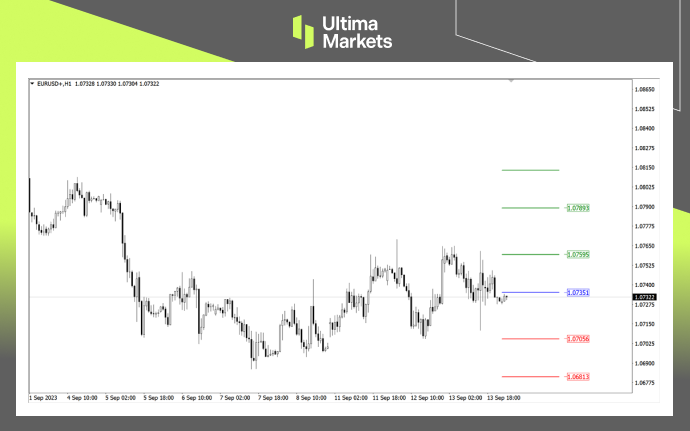
According to the pivot indicator in Ultima Markets MT4, the central price of the day was 1930.16.
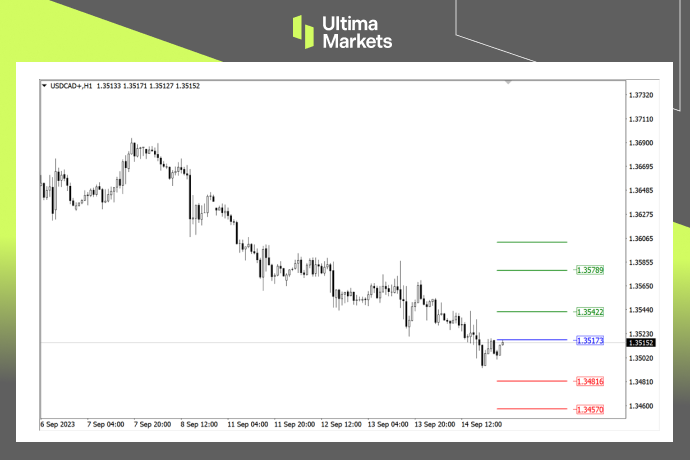
Bullish above 1930.16, the first target is 1937.62, and the second target is 1941.74
Bearish below 1930.16, first target 1925.98, second target 1918.40
Disclaimer
Comments, news, research, analysis, prices and other information contained in this article can only be regarded as general market information, provided only to help readers understand the market situation, and do not constitute investment advice. Ultima Markets will not be responsible for any loss or loss (including but not limited to any loss of profits) that may arise from the direct or indirect use or reliance on such information.