Boeing Bottoms Out on Fruitful Gains at Airshow 

China Expected to Lift Procurement Ban during APEC 

On Nov. 13th, the Dubai Airshow commenced, and Boeing (BA.US), the jet manufacturer of Dow Jones, has already successfully secured a series of significant orders. Emirates has agreed to acquire 90 Boeing 777 aircraft, which are valued at an impressive $52 billion. Additionally, Emirates’ sister airline, Flydubai, will be incorporating 30 Boeing 787 Dreamliners into its fleet through an $11 billion agreement. This significant deal arrives at a time when Emirates is looking to enhance its aircraft portfolio. 
 
Separately, SunExpress, a joint venture between Turkish Airlines and Lufthansa, also announced a major order for Boeing 737 aircraft. The deal includes an order for 28 737-8 models and 17 737-10 models, with the option to purchase up to 45 additional 737 MAX planes. SunExpress has previously placed an order for 42 737-8 aircraft, of which nine have already been delivered. Furthermore, Ethiopian Airlines finally announced that it has decided to resume flying the 737 MAX after the 2019 crash incident. Ethiopian Airlines revealed on Tuesday that it has agreed to a deal with Boeing for the purchase of 20 737 MAX planes and 11 more 787 Dreamliners. Boeing stated that the sale was the largest-ever purchase of its airplanes in African history, however, declined to disclose the value of the deal.  

According to reports, China is considering lifting a sales freeze on Boeing 737 Max jets, potentially paving the way for the planemaker to resume sales in the country. The news comes as President Biden and President Xi are set to meet at the APEC conference in San Francisco, raising the possibility that the sales freeze could be lifted in conjunction with the meeting. While China is reportedly considering a commitment to purchase 737 jets, discussions are still underway and President Xi is not expected to announce a formal order. If this move comes to fruition, it would be a major development for Boeing, which hasn’t made significant sales in China since 2018 following the grounding of the 737 Max after two crashes. After receiving a string of positive updates, Boeing experienced two consecutive days of trading gains. 

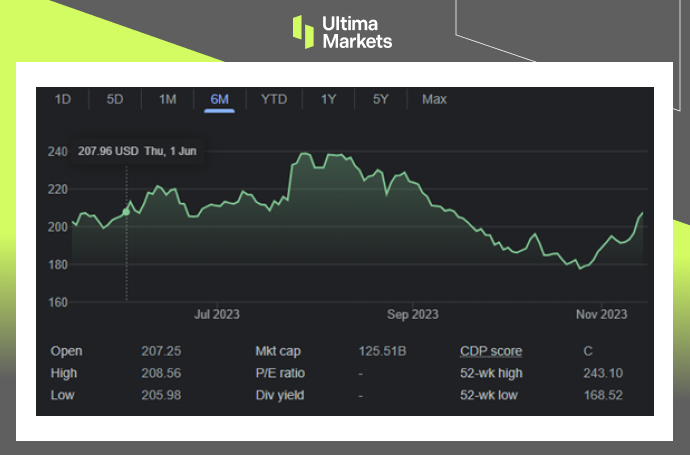
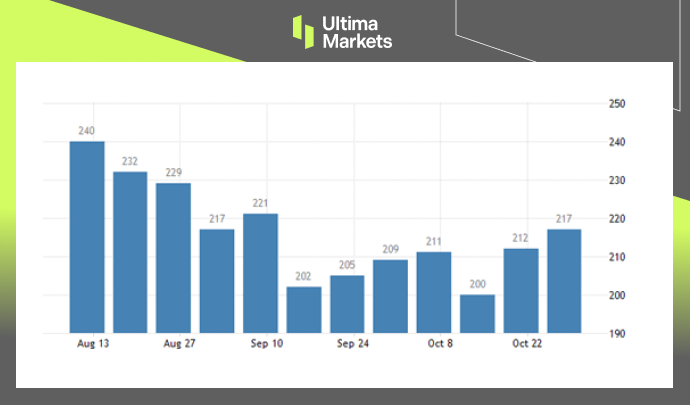
(Boeing Stock Performance Six-month Chart) 

Disclaimer  

Comments, news, research, analysis, price, and all information contained in the article only serve as general information for readers and do not suggest any advice. Ultima Markets has taken reasonable measures to provide up-to-date information, but cannot guarantee accuracy, and may modify without notice. Ultima Markets will not be responsible for any loss incurred due to the application of the information provided. 

TSM October Revenue Explode, Surpassing NT$15 Trillion Value


TSM Achieved a Record-high Revenue Last Month

On November 10, Taiwan Semiconductor Manufacturing Company (TSM.US) announced that its October revenue was a record-breaking US$7.53 billion (NT$243.2 billion), representing a notable 34.8% increase from September and a 15.7% raise from the same period last year.

TSMC Consolidated October Revenue

(TSMC Consolidated October Revenue) 


Unveiling the TSM’s Revenue Numbers

TSMC’s cumulative revenue for the first 10 months of 2023 stood at an impressive US$55.6 billion, showcasing a modest 3.7% decline from the corresponding period in 2022.

The company’s resilience in navigating the challenges posed by weaker global demand in certain sectors, particularly consumer electronics, is evident in these numbers.

The surge in demand for TSMC’s cutting-edge 3nm technology played a pivotal role in its ADR surging more than 6% following the earnings release.


TSM’s Leadership Insight

C. C. Wei, TSMC’s CEO, expressed unwavering optimism regarding the chip market during a recent statement. He anticipates that the company will soon overcome the challenges of a prolonged sluggishness, primarily attributed to the lingering effects of the COVID-19 pandemic.

The surge in the AI industry, driven by an increased need for chips used in training large language models, has significantly contributed to TSMC’s positive outlook.


TSM’s Technological Prowess

TSMC’s third-quarter revenue surge was underpinned by its advanced technology, with the 3nm, 5nm, and 7nm processes collectively accounting for an impressive 59% of the company’s total revenue.

Looking ahead, TSMC is set to push the boundaries further by mass-producing an even more advanced 2nm process in 2025. This ambitious move is poised to solidify TSMC’s position as a trailblazer in high-end technology development.


TSM’s Future Projections

As we look toward the future, TSMC’s fourth-quarter revenue for 2023 is anticipated to range between US$18.8 billion and US$19.6 billion, with an estimated midpoint of US$19.2 billion (approximately NT$614.4 billion at the current exchange rate of NT$32 per US$1).

This represents an impressive approximately 11.1% increase on a quarterly basis. Despite the expectation of a slight dip in revenue in November and December compared to the stellar October figures, TSMC remains confident in achieving its financial forecast target.

The company estimates that the revenue in the remaining two months will average around US$5.84 billion.


Bottom Line

In conclusion, TSMC’s stellar performance in October is a testament to its resilience, technological prowess, and strategic vision.

The company’s commitment to advancing semiconductor technology, coupled with its optimistic outlook despite global challenges, positions TSMC as a formidable leader in the high-end technology landscape.

As TSMC continues to push the boundaries of innovation, the industry watches eagerly to witness the unfolding chapters of its success story.


Understanding India’s Industrial Growth Dynamics


Industrial Growth in India Decelerated to 5.8% in September, Marking a Three-Month Low Compared to 10.3% in August

In the realm of economic fluctuations, India stands as a significant player, showcasing its industrial prowess amidst a landscape shaped by various factors.

Recent statistical revelations have illuminated the nuances of the country’s industrial growth, marking a shift in trajectory.


Deceleration in Growth: Unraveling the Numbers

The Ministry of Statistics & Programme Implementation (MOSPI) recently disclosed a notable deceleration in India’s industrial growth, registering a 5.8% year-on-year expansion in September.

This marked a notable decline from the robust 10.3% witnessed in the preceding month of August, signifying a trend change.

This deceleration primarily found its roots in the manufacturing sector, a pivotal pillar in India’s industrial landscape.

India Industrial Production, MOSPI Line Graph by Ultima Markets MT4

(India Industrial Production, MOSPI) 


Manufacturing Sector: A Key Player

The heartbeat of India’s industrial landscape, the manufacturing sector, underwent a 4.5% increase in output in September 2023, showcasing a notable surge from the 2.0% growth reported in the same period last year.

However, August’s buoyant growth, boasting a 9.3% increase, contrasted starkly against September’s tempered surge, outlining a clear trajectory shift.


Dissecting Sectoral Performance

Delving deeper into the fabric of industrial domains, the mining and electricity sectors portrayed a story of their own. The mining sector witnessed a 11.5% year-on-year growth in September, a tad lower than the 12.3% observed in August.

Similarly, the growth in electricity output decelerated to 9.9% in September, down from the substantial 15.3% recorded in the preceding month.


Causal Threads: Festivals and Weather Conditions

The festive calendar, a celebrated facet of Indian culture, intertwined with adverse weather conditions, emerged as pivotal factors contributing to the substantial easing observed across sectors.

These elements, intrinsic to the social and climatic fabric of the nation, influenced the industrial output significantly.


Currency Dynamics: The Tale of the Indian Rupee

Simultaneously, the Indian rupee experienced a fluctuating trajectory, edging closer to a record low against the USD.

Sustained capital outflows from the Indian economy contributed to this, prompting the Indian rupee to depreciate beyond 83 per USD in November.

The Reserve Bank of India’s proactive stance, selling foreign exchange reserves to prevent further devaluation, played a pivotal role in maintaining a delicate balance.

USD/INR 1-year Chart By Ultima Markets MT4

(USD/INR 1-year Chart) 

The Reserve Bank’s Role: A Balancing Act

The RBI’s consistent sale of foreign exchange reserves, totaling over $23 billion in the past four months, illustrates the active role played in stabilizing the Indian rupee’s value.

This strategic move has curbed excessive bearish positions on the currency, sustaining a delicate equilibrium amidst global economic ripples.


Navigating the Industrial Seas Ahead

As India charts its economic trajectory, acknowledging the impact of festivals, climatic variables, and global economic dynamics remains imperative. The interplay of these elements, intertwined with the resilience and adaptability of its industrial landscape, will shape the nation’s growth story.

In conclusion, India’s industrial growth paints a narrative of resilience amidst evolving circumstances, embodying a blend of challenges and strategic maneuvering to maintain equilibrium and foster sustainable growth.


Korean Won Revived After Interventions by Korean Government

Understanding the South Korean Currency Dynamics and Market Interventions

In the global financial landscape, the South Korean Won (KRW) has showcased a narrative of resilience and volatility in recent months, reflecting the intricate interplay of global economic forces and local regulatory interventions.

Let’s delve into the multifaceted factors contributing to the EBB and flow of the Won against the US dollar, examining how interventions and market movements have sculpted its trajectory.


Korean Won Revived in November

November witnessed a striking revival for the South Korean Won, marking a surge to approximately 1310 per USD, bouncing back from an 11-month low of 1356 in the previous month.

This resurgence owes itself to several factors, notably the perceptible weakening of the US dollar and a notable shift in the Federal Reserve’s stance towards a more dovish monetary policy. The termination of the rate-hike campaign from the Fed notably bolstered the Won’s value.

USD/KRW One-year Chart From Ultima Markets MT4

(USD/KRW One-year Chart) 


Market Influence and Regulatory Actions

The Won’s resurgence was complemented by heightened foreign investment in the stock market, further underpinned by the decision of authorities to extend the ban on short selling until at least June of the following year.

However, despite these positive market movements, the year saw the Korean currency witnessing a 4% fall against the US dollar. This depreciation was propelled by multifaceted elements, including geopolitical risks, flight to safety, and a widening interest rate gap between South Korea and the US.


Market Intervention and the Central Bank’s Role

The Bank of Korea (BOK) played a pivotal role in curbing the Won’s depreciation, intervening in the forex market consistently throughout the year.

This proactive intervention led to a decline in foreign exchange reserves, which hit $412.87 billion in October, representing the lowest figures since June 2020.


Navigating Forex Reserves and Market Stability

South Korea’s foreign reserves faced a continuous decline, attributed to their utilization in stabilizing the foreign exchange market, a move sanctioned by the Bank of Korea.

By October’s closure, these reserves had diminished to $412.87 billion, showing a decrease of $1.24 billion from the prior month.

The breakdown of these reserves into various components like securities, deposits, special drawing rights, gold bullion, and IMF positions reflects a diverse strategy in safeguarding market stability.


Foreign Exchange Reserves Lowest in Over Three Years 

South Korea’s foreign reserves fell for the third consecutive month as they were used to stabilize the foreign exchange market, according to the Bank of Korea (BOK). By the end of October, foreign currency reserves were $412.87 billion, down $1.24 billion from the previous month.

The reserves included $369.98 billion in securities, $18.87 billion in deposits, $14.77 billion in special drawing rights, $4.79 billion in gold bullion, and $4.45 billion in the IMF position.

South Korea remained the world’s ninth-largest holder of foreign reserves as of the end of September. Despite the declining trend, the central bank is not worried.

The BOK Governor Rhee Chang-yong said in late October that reserves have been stable since 2021 and increasing them further would come at a cost.  

Foreign Exchange Reserves, Bank of Korea in a Bar Chart

(Foreign Exchange Reserves, Bank of Korea) 


Bottom Line

The South Korean currency’s trajectory reflects a dynamic interplay of global economic forces, market sentiments, and regulatory interventions.

As the authorities balance stability and growth, the resilience and adaptability of the Won against external pressures become increasingly evident.

Understanding this complex landscape is pivotal for stakeholders navigating the South Korean financial markets, highlighting the intricate balance between interventions and market dynamics.


Switzerland Tops Euro Nations With Remarkable Inflation Rate


Inflation Rate Remains Unchanged at 1.7%

Switzerland stands out as a beacon of stability and resilience.

In October 2023, the annual inflation rate in Switzerland remained steady at 1.7%, meeting market predictions. There was a 0.1% increase in the Consumer Price Index (CPI) compared to the previous month, reversing a 0.1% decline.

Several factors contributed to the 0.1% month-on-month increase, including higher heating oil and air transport prices. Women’s coats and jackets, as well as foreign red wine, also experienced price hikes. On the other hand, prices for hotels, petrol, and fruiting vegetables declined. 


Factors Driving Inflation

1. Energy Sector Impact

The month-on-month increase is partly attributed to higher heating oil and air transport prices. Switzerland’s strategic measures to navigate the challenges posed by escalating energy costs have not only maintained stability but have also propelled the nation forward.

2. Commodities Market Influence

Specifically noteworthy are the price hikes in women’s coats and jackets, alongside foreign red wine. These seemingly disparate sectors contribute to the intricate dance of the Swiss economy, showcasing adaptability in the face of diverse market forces.

3. Countering Declines

Conversely, certain sectors experienced price declines. Notably, hotels, petrol, and fruiting vegetables saw reduced prices. This balanced approach to inflationary pressures exemplifies Switzerland’s commitment to equilibrium in the marketplace.


Harmonised Index of Consumer Prices (HICP)

The Harmonized Index of Consumer Prices (HICP) allows for inflation comparison between Switzerland and other European Union member countries, as it uses a standardized methodology across the EU.

The cost of living in Switzerland, as measured by the HICP, went up 0.1% for the third month running, indicating that inflation continued its gradual increase despite relatively low overall inflation numbers. On a year-over-year basis, it went up by 2.0%.

Swiss Consumer Price Index, Federal Statistical Office FSO Bar Chart

(Swiss Consumer Price Index, Federal Statistical Office FSO) 

International Benchmarking

Switzerland, often overshadowed by its European counterparts, emerges as a beacon of fiscal prudence. Continuously surpassing both Germany and the European Monetary Union in inflation performance, Switzerland’s economic strategy underscores a commitment to outpacing global standards.


Swiss Franc Rebounds from One-month Low 

Beyond inflation, the resurgence of the Swiss franc demands attention.

Rebounding from a one-month low, the franc strengthened beyond 0.9 per USD, marking a significant recovery from the four-week low at 0.91 on October 31.

This resurgence can be attributed to the proactive intervention of the Swiss National Bank (SNB)

USD/CHF 1-year Chart By Ultima Markets MT4

(USD/CHF 1-year Chart) 

SNB’s Strategic Intervention

The SNB’s substantial sale of foreign exchange reserves underscores a proactive approach to support the franc. This intervention, aimed at mitigating the impact of import inflation resulting from higher energy prices, showcases the SNB’s commitment to maintaining economic stability.

Foreign Exchange Dynamics

Remarkably, data from the SNB reveals that its foreign exchange reserves reached their lowest level in over five years in September. This deliberate reduction aligns with Switzerland’s strategic vision, prioritizing currency strength and resilience in the face of global economic challenges.


Bottom Line

In conclusion, Switzerland’s economic landscape stands as a testament to resilience, strategic planning, and fiscal prudence.

The nation’s ability to navigate inflationary pressures while concurrently bolstering its currency is a model for others to emulate.

As we delve into the intricacies of Switzerland’s economic narrative, it becomes evident that the nation’s commitment to stability positions it as a formidable force in the global economic arena.


Singapore’s PMI Moderate Growth, Index Hits 1.2-Year High


Singapore’s Manufacturing Sector: A Resilient Recovery and Soaring Confidence

In the ever-evolving landscape of Singapore’s manufacturing sector, the latest data paints a promising picture of recovery and growth.

The Purchasing Managers’ Index (PMI) for October 2023 inched up slightly to 50.2, marking the second consecutive month above the pivotal 50-point threshold.

This upward trend signals a robust recovery and an expansion of factory activity, underlining the resilience of Singapore’s manufacturing landscape.


Steady Gains in Key Metrics

Crucial metrics such as factory output, new exports, and employment have witnessed positive developments, indicating a steady climb back to pre-contraction levels. This optimistic trend is particularly encouraging given the recent six-month contraction period.

Despite the challenges posed by sluggish external demand, the manufacturing sector is demonstrating its ability to adapt and thrive.

Simultaneously, the electronics sector, which accounts for approximately 40% of Singapore’s industrial output, saw its activity decline for the 15th consecutive month in October. However, the rate of decline moderated slightly, with a reading of 49.9 compared to 49.8 in September.  

Singapore Manufacturing PMI, SIPMM Graph

(Singapore Manufacturing PMI, SIPMM)

Factory Output Takes Center Stage

Factory output, a cornerstone of manufacturing vitality, has shown notable improvement. The positive momentum suggests increased production activities, reflecting not only a recovery but also a potential uptick in consumer demand.

This bodes well for the overall economic landscape, as manufacturing often serves as a barometer for broader economic health.

New Exports Signal Global Relevance

The uptick in new exports is another noteworthy aspect of Singapore’s manufacturing resurgence. Despite external challenges, the sector is positioning itself on the global stage, showcasing its resilience and adaptability.

This is a testament to the competitiveness of Singaporean products in the international market.

Employment on the Rise

A positive correlation between increased factory activity and employment growth is a pivotal marker of a thriving manufacturing sector. As the manufacturing landscape expands, job opportunities follow suit, contributing to the overall economic well-being of the nation.


Navigating Challenges: A Balanced Outlook

While the overall trajectory is positive, it’s crucial to acknowledge and address the challenges that persist. Despite improvements, input purchases and new orders continue to contract, influenced in part by the economic deceleration in China and geopolitical tensions.

Additionally, supplier deliveries have experienced deterioration, reflecting the interconnected nature of global supply chains.

Electronics Sector: A Mixed Bag

The electronics sector, a significant contributor to Singapore’s industrial output, witnessed a decline for the 15th consecutive month in October. However, the rate of decline moderated slightly, signaling potential stabilization. This nuanced perspective underscores the sector’s resilience amid external pressures.


Business Confidence: Reaching New Heights

Beyond the numbers, the third quarter of 2023 brought a surge in business confidence, reaching its highest level in 18 months. This surge, from a confidence index of 6 to 7, signifies a renewed optimism within the manufacturing community.

Business Confidence, Singapore Department of Statistics Bar Chart

(Business Confidence, Singapore Department of Statistics) 

Electronics Industry: A Driving Force

The electronics industry, particularly the semiconductor segment, emerged as a major driver of this newfound confidence. The confidence index soared from 11 in the second quarter to an impressive 23 in the third quarter.

This surge underscores the pivotal role of semiconductors in shaping the outlook of the manufacturing sector.

General Manufacturing: Diverse Optimism

Diversification of optimism is evident in the general manufacturing sector, where an overall increase from -8 to 6 is observed. This shift is primarily attributed to positive sentiments surrounding food, beverages, and tobacco manufacturing.

The sector’s ability to adapt and pivot towards areas of demand is a testament to its resilience.


Sector-Specific Variances: A Nuanced Landscape

While overall confidence rose, specific sectors experienced divergent trends. The transport engineering sector witnessed a dip from 43 to 35, signaling a need for strategic adjustments.

Similarly, assessments for the chemicals, biomedical manufacturing, and precision engineering segments saw fluctuations, highlighting the importance of targeted strategies for sustained growth.

In conclusion, Singapore’s manufacturing sector is on a trajectory of resilience and recovery. The positive indicators across key metrics and the surge in business confidence underscore the adaptability and strength of the sector.

As challenges persist, addressing them with strategic precision will be paramount in ensuring a sustained and robust manufacturing landscape for Singapore.


The Canadian Dollar Recovered from One-Year-Low of Weak USD


CAD Bounced, But Appreciation Capped 

The Canadian dollar has strengthened to 1.37 per USD, bouncing back strongly from the one-year low of 1.39 reached on November 1st.

This recovery was strengthened by a general retreat in the DXY index, as weak economic data from the US reinforced the Federal Reserve’s indications that they may hold off on further interest rate hikes.

However, the appreciation was limited by disappointing domestic economic data, which increased expectations of a less aggressive stance by the Bank of Canada (BoC).

(USD/CAD Six-month Chart) 


CAD Resurgence: Unveiling the Drivers

The rebound in the CAD is primarily driven by external macroeconomic factors:

DXY Index Retreat: The decline in the DXY index, which measures the USD’s strength against major currencies, is a pivotal factor.

This decrease in USD strength is linked to weak economic data from the United States, reinforcing the Federal Reserve’s inclination toward a more prudent approach to interest rate hikes.

This decline in USD strength has provided essential support for the CAD’s appreciation.


Domestic Economic Headwinds: Understanding the Constraints

The CAD’s upward momentum is hindered by domestic economic challenges:

  • Rising Unemployment: Canada’s unemployment rate surged to 5.7% in October, the highest level in 21 months. This unexpected increase has raised concerns about the stability of the Canadian labor market.
  • Sluggish Wage Growth: The ongoing deceleration in wage growth is a significant issue. Slower wage growth affects consumer spending and economic sentiment, adding to uncertainty in the market.
  • Faltering Job Creation: Job creation in Canada has fallen short of expectations, highlighting a pronounced weakness in the labor market. The inability to meet job creation projections amplifies concerns about the overall health of the Canadian economy.

Bank of Canada’s Approach: Navigating Economic Waters

The role of the Bank of Canada is paramount in shaping the CAD’s trajectory:

  • Interest Rate Policy: In a recent meeting, the BoC opted to maintain unchanged interest rates. However, the central bank has expanded its flexibility regarding future rate hikes. This shift indicates the BoC’s concern about the repercussions of previous tightening measures.
  • Dampened Demand and Inflation: The BoC has recognized that previous rate hikes have curbed demand and restrained inflation. This suggests a more measured approach to monetary policy, striking a balance between stimulating economic growth and managing inflation.

Conclusion: An Insightful Perspective

To sum up, the CAD’s resurgence from a one-year low is underpinned by a complex interplay of external and domestic factors.

While the retreat of the DXY index and the Federal Reserve’s policy stance have buoyed the CAD, the constraints of a challenging labor market and the BoC’s nuanced policy approach remain substantial challenges.

Staying vigilant in monitoring these factors is vital for investors and businesses as they navigate the intricate financial landscape.


Understanding the Recent Surge in GBP Value


The Impact of BOE and FED Decisions on the British Pound and Economy

The British pound has seen a remarkable resurgence in recent times, climbing above the $1.23 mark against the US dollar. This is the highest level for the pound since mid-October 2022.

The rise can be attributed to key decisions and outlooks from both the Bank of England (BOE) and the US Federal Reserve.


Factors Driving the Pound’s Rise

Several factors related to the stances of the BOE and Fed have contributed to lifting the pound:

  • Fed holds interest rates steady – The Fed’s decision not to raise rates further due to signs of slowing US job growth has boosted confidence in the pound as an investment option compared to the dollar.
  • BOE maintains firm interest rate stance – By holding its key rate at a 15-year high of 5.25%, the BOE has signaled its commitment to stability and shored up faith in the pound.
  • Reassurance from Governor Bailey – Comments from BOE Governor Andrew Bailey signaling no near-term rate cuts and upholding guidance on further hikes has reinforced the bank’s position.
GBP/USD 1-year Chart By Ultima Markets MT4

(GBP/USD 1-year Chart) 


Bank of England Outlook and Policy

The BOE has provided clarity around its monetary policy outlook and intentions:

  • No rate cuts expected soon – Bailey has indicated rate reductions are not on the horizon, offering certainty to markets.
  • Potential 3 quarter-point cuts by end 2024 – Markets speculate up to 75 basis points in cuts could come in 2024 as the BOE eyes the weak growth outlook.
  • On track to meet inflation target – BOE forecasts show inflation is slated to halve by year-end to meet the 2% target.
  • Inflation to remain above target until late 2025 – Projections see inflation at 3.1% in Q4 2024 before declining to 1.9% in Q4 2025, underscoring the bank’s anti-inflation stance.

Bank of England Interest Rate Projections

PeriodInterest Rate Projection
Q4 20225.25%
Q4 20234.50%
Q4 20243.75%
Q4 20253.00%
These data are from Bank of England
United Kingdom Interest Rate by Bank Of England

(United Kingdom Interest Rate, BOE)


Economic Headwinds Facing the UK

While positive for the pound, the BOE has cautioned around significant challenges for the UK economy:

  • Q3 growth stagnation – Economic expansion stalled in the third quarter of 2022.
  • Minimal Q4 growth expected – Forecasts show just 0.1% GDP growth to close out 2022.
  • Subdued 2023 growth outlook – The BOE sees the UK economy contracting throughout 2023.
  • High energy costs hit output – Expensive energy is forcing firms to cut back production.
  • Labor market concerns – Despite low unemployment, weak wage growth and poor productivity weigh on the economy.
  • Global slowdown impacts exports – Weaker EU and US markets are dampening demand for UK exports.

Impact on the British Pound

The pound’s rally indicates it remains an attractive safe-haven currency investment despite clouds on the UK’s economic horizon:

  • BOE policy credibility supports pound – The central bank’s consistency and transparency in laying out its policy intentions instills market trust in the pound.
  • UK rate advantage persists over dollar – The Fed being closer than the BOE to ending its tightening cycle preserves higher yield appeal for sterling.
  • Inflation fight remains intact – The BOE’s commitment to getting inflation down reinforces the pound as a stable store of value.
  • Economic challenges mainly priced in – Markets have largely priced in the headwinds facing the UK economy, limiting downside for the pound.

Conclusion

In summary, the BOE and Fed’s policy signaling has provided key support for the British pound’s surge above $1.23.

Despite economic struggles ahead, the UK central bank’s firm anti-inflation stance and rate advantage over the dollar are likely to continue underpinning sterling strength.

However, further dollar gains on aggressive Fed tightening or an unanticipated BOE pivot on rates pose risks.

Overall, the pound looks set to remain on solid footing as long as the BOE maintains policy credibility.


US Stock Market’s Recent Surge Thanks To Cool Labor Market


The Bright Outlook for US Stocks: A Market Analysis

In November 2023, the US stock market witnessed a significant upswing, reinforcing expectations of an end to the era of rate hikes.

The Dow Jones index soared by more than 560 points on November 2nd, marking its most remarkable daily gain since June. Simultaneously, the S&P recorded a 1.89% surge, its most substantial single-day increase since April. The Nasdaq also celebrated a robust performance, closing 2.36% higher, its best showing since July.

This impressive market rally was underpinned by gains in the energy and real estate sectors, both of which secured advances exceeding 3.0%. These substantial gains contributed to all eleven S&P sectors concluding the session on a positive note.


US Stocks Saw Strong Buying Across Sectors 

The momentum behind these stock market surges is closely tied to growing expectations regarding the Federal Reserve’s future monetary policy.

As this sentiment gains traction, investors and market participants are becoming increasingly confident that the central bank is nearing the completion of its rate-hiking efforts.

Additionally, the benchmark US 10-year yield fell to its lowest level in three weeks, reaching 4.65%. This decline further signifies the market’s anticipation of a more accommodative monetary stance


Robust Sector Performance

One of the most notable aspects of this remarkable stock market rally is the broad-based nature of the gains. Notably, the energy and real estate sectors exhibited exceptional strength, each securing advances exceeding 3.0%.

These gains underscore the market’s confidence in the economic outlook and support the view that the recovery remains firmly on track.

Sector Performance by Bloomberg

(Sector Performance, Bloomberg) 


Signs of a Weakening Job Market

While the stock market flourishes, the job market faces challenges, which require close scrutiny:

  • Unemployment Claims: The number of Americans applying for unemployment benefits increased to 217,000, surpassing market estimates. This indicates that unemployed individuals are encountering difficulties in finding employment.
  • Continuing Jobless Claims: Continuing claims rose to 1,818,000, exceeding market expectations. These figures align with signals from the Federal Reserve, suggesting that labor market conditions are softening.
  • Nonfarm Payrolls: All eyes are now on the upcoming nonfarm payrolls report, with economists predicting an increase of 180,000 jobs in October, following a substantial gain in September. This report will provide crucial insights into the job market’s health.
Initial Jobless Claims by United States Department of Labor

(Initial Jobless Claims, United States Department of Labor) 


Bottom Line

In conclusion, the US stock market’s recent surge is a significant development with far-reaching implications. As the market regains strength, it underlines the growing confidence in a more accommodative monetary policy by the Federal Reserve.

However, it’s vital to balance this optimism with the challenges in the job market, as signs of weakness in unemployment claims and continuing claims signal potential hurdles in the economic recovery.

The interplay between these factors will undoubtedly shape the trajectory of the US economy in the months to come.


FED’s Latest Move and November 2023’s ISM Manufacturing PMI


The Impact of FED’s Decision and ISM Manufacturing PMI in November 2023

In November 2023, the Federal Reserve (FED) once again held its rates unchanged, marking the second consecutive time for such a decision. Investors and financial experts alike anticipated and conjectured about this FED move.

In addition, the Manufacturing Purchasing Managers Index (PMI) for October was released by the Institute for Supply Management (ISM), providing insight into the status of the US manufacturing industry.


Key Takeaway: FED’s Inflation Concerns

The FED’s Response to Inflation

The foremost concern addressed by the FED was the persistence of high inflation. FED Chairman Jerome Powell emphasized that inflation had exceeded the FED’s long-term target of 2%. Specifically, the total Personal Consumption Expenditures (PCE) prices had surged by 3.4% over the 12 months ending in September.

Federal Funds Rate, FED by Ultima Markets MT4

(Federal Funds Rate, FED)

Monetary Policy Consideration

Powell’s statement shed light on the FED’s approach to managing inflation. He articulated that any future rate hikes would be executed with great caution, considering factors such as the cumulative impact of prior rate adjustments, the time lag in the transmission of monetary policy effects, and the prevailing economic and financial market conditions.

Market Impact: USD Index Decline

Following the FED’s announcement, the USD index (DXY) experienced a noticeable decline, moving from 106.66 to 106.35. This underscores the strong correlation between the FED’s monetary policy decisions and currency markets, making them of paramount importance to traders and investors.


Insights into ISM Manufacturing PMI for October 2023

The Escalating Contraction

The ISM’s Manufacturing PMI data for October 2023 unveiled a worrisome trend. The U.S. manufacturing sector continued to contract, with the pace of contraction intensifying. The PMI declined by 2.3%, reaching 46.7%, in contrast to the 49% recorded in September, emphasizing the sector’s ongoing challenges.

Manufacturing Purchasing Managers Index PMI, ISM By Ultima Markets MT4

(Manufacturing Purchasing Managers Index PMI,ISM)

Decline in New Orders

A critical factor contributing to the sector’s struggles is the downturn in new orders. Firms are grappling with reduced demand for their products, which has a detrimental impact on production and overall growth.

Challenges in Export Orders

While there was a moderate rise in the new export orders index, it remained within contraction territory. This suggests that the international market is not providing the expected boost to U.S. manufacturers.

Backlogs of Orders: A Persistent Issue

The backlogs of orders index also saw a slight decline, maintaining its position within sharp contraction territory. This signifies that manufacturers are contending with the backlog of existing orders, which can have ripple effects on future production.


Bottom Line

In conclusion, the FED’s unwavering stance on interest rates and the ISM Manufacturing PMI for October 2023 offer essential insights into the state of the U.S. economy. Staying well-informed about these developments is vital for making sound financial decisions in a constantly evolving economic landscape.