Comprehensive EUR/USD for November 1, 2023
In this comprehensive analysis, Ultima Markets brings you an insightful breakdown of the EUR/USD for 1st November 2023.
Key Takeaways
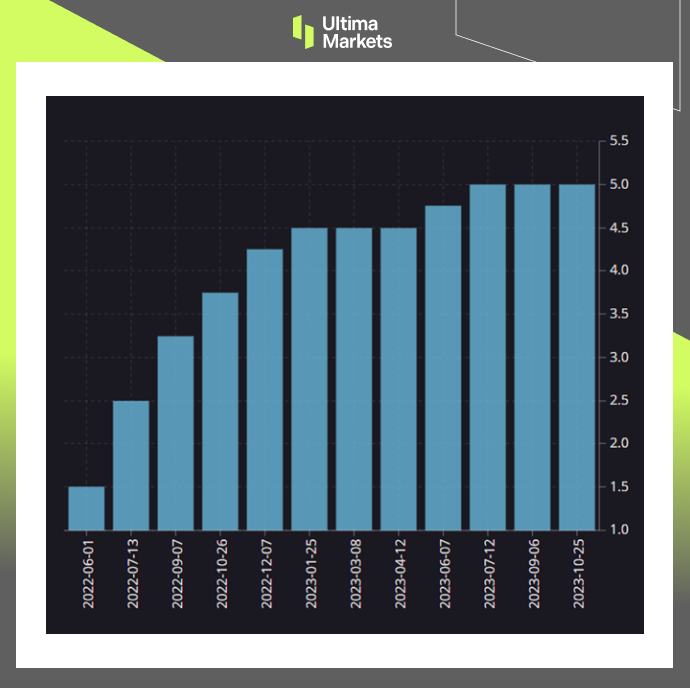
- ECB monetary policy: The latest interest rate decision of the European Central Bank has chosen to suspend interest rate hikes, it is the first time since July 2022. As expectations for the suspension of interest rate hikes have been generally reflected in the markets, short-term volatility in Europe and the United States will be modest.
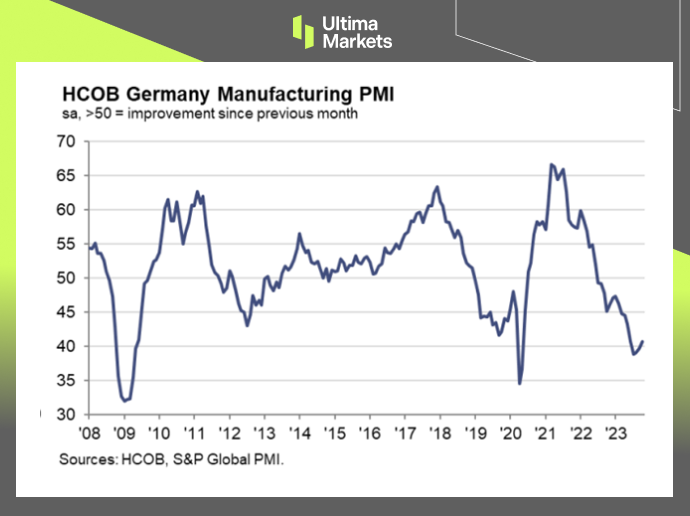
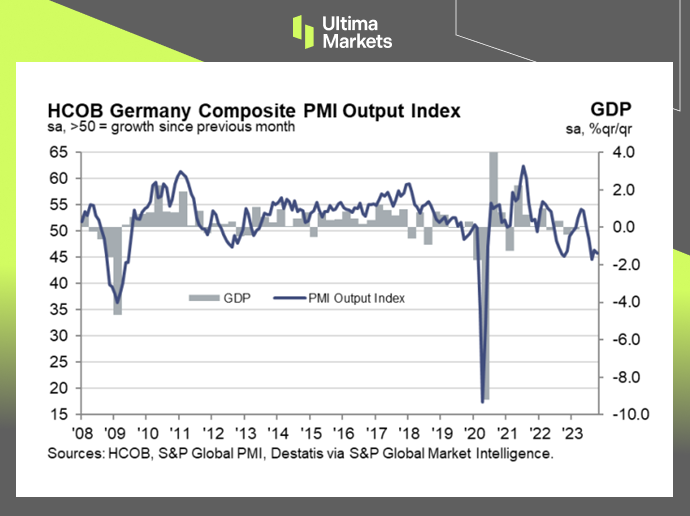
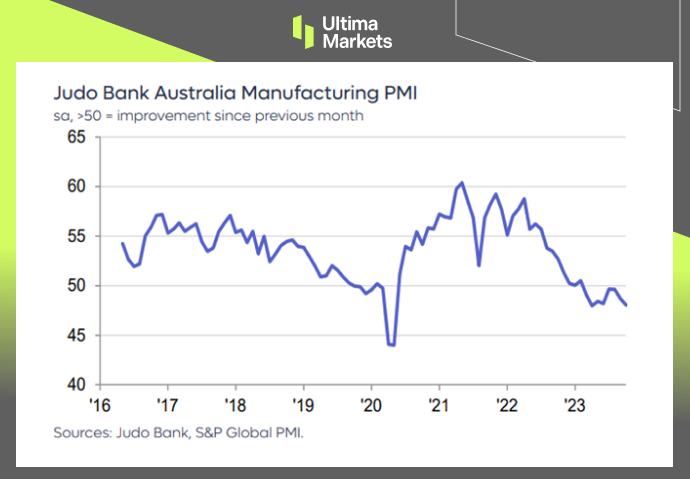
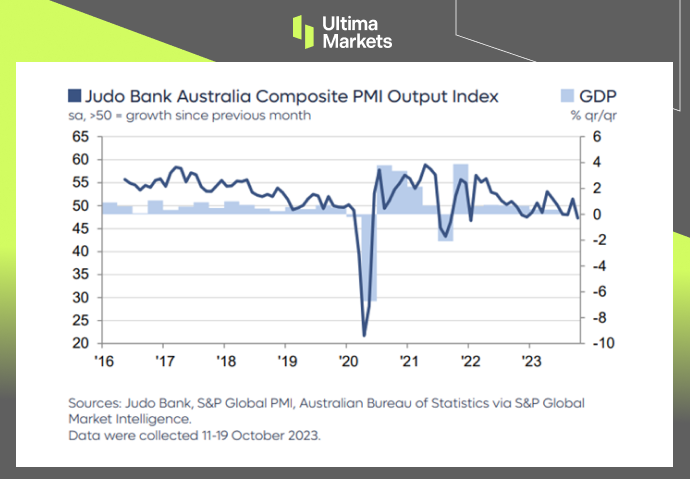
- Economic outlook for the Eurozone: The manufacturing industry in the Eurozone continues to decline, the service industry is weak, demand is sluggish, and the economy may remain fragile in the coming months.
- The US dollar may be strong: The market is betting that the interest rate decision announced by the Federal Reserve early Thursday may not raise interest rates, but may maintain hawkish rhetoric. The yield of two-year US bonds, which are more sensitive to monetary policy, rose to 5.08%
EUR/USD Technical Analysis
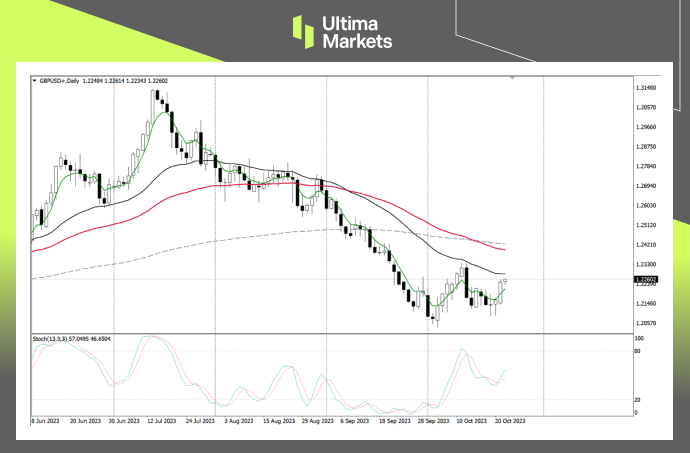
EUR/USD Daily Chart Insights
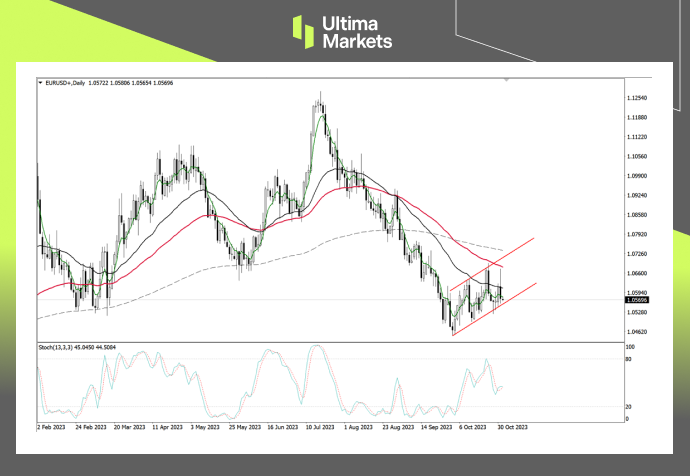
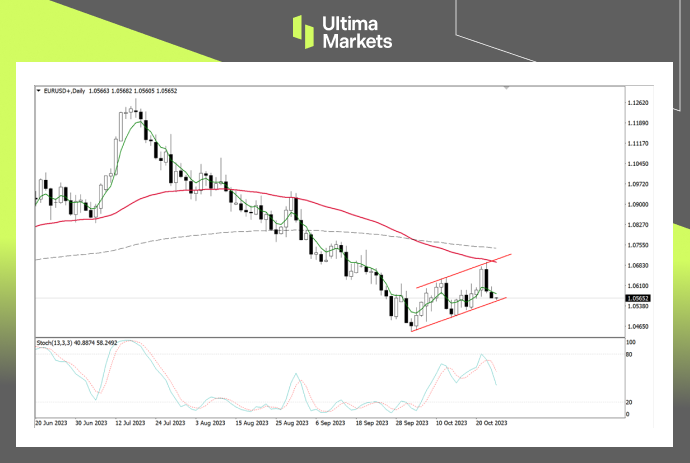
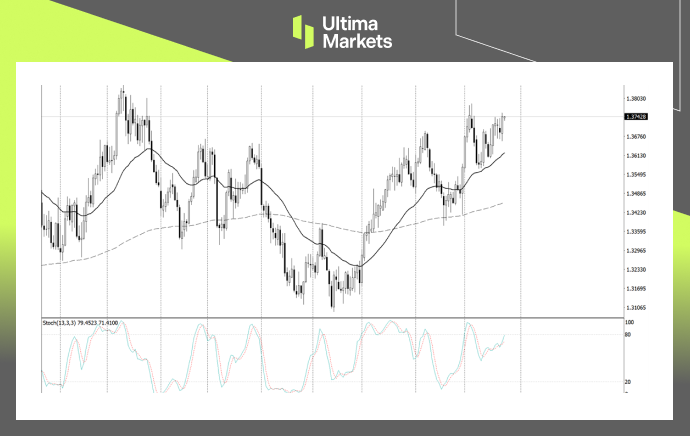
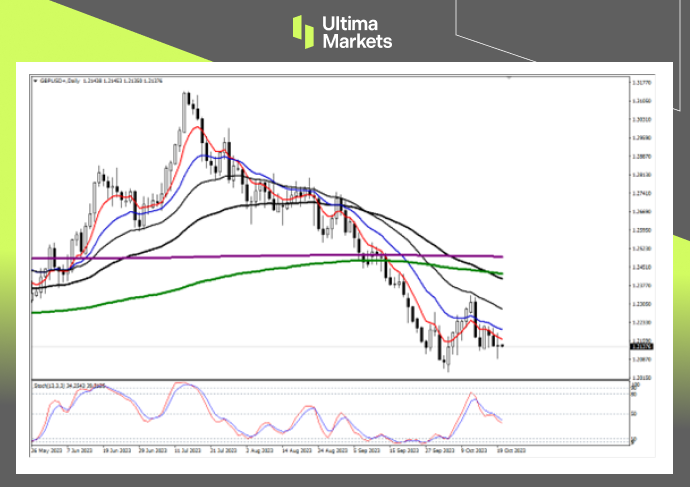
- Stochastic Oscillator: The indicator’s fast line and slow line were entangled yesterday, and the market entered a oscillating rhythm again. Wait for the indicator to show long or short signals.
- Price Action: After the exchange rate returns to the moving average, a pin bar appears, indicating that short sellers have the upper hand, but short sellers still need to wait for the market to fall below the previous low price of 1.0520.
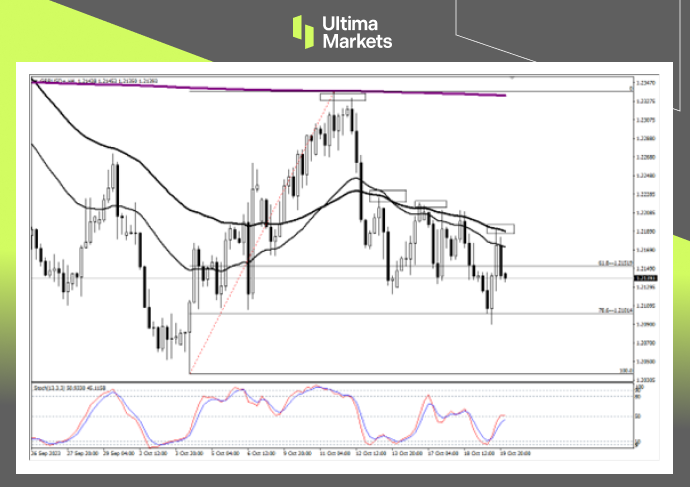
- Flag-shaped consolidation structure: The exchange rate has fluctuated upward since October 4, and the overall price has shown a flag-shaped shock range. The 65 moving average successfully suppressed the further rebound of the exchange rate. Next, we will pay attention to whether today’s market can fall below the range. If the range is still effectively supported, the market will rebound and rise again. Otherwise, short opportunities will come.
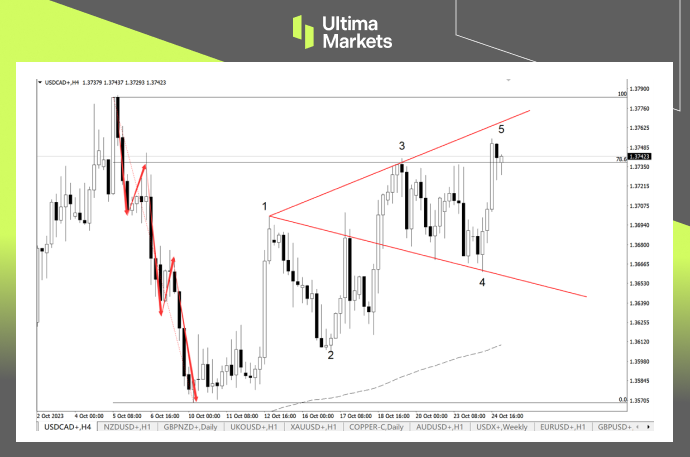
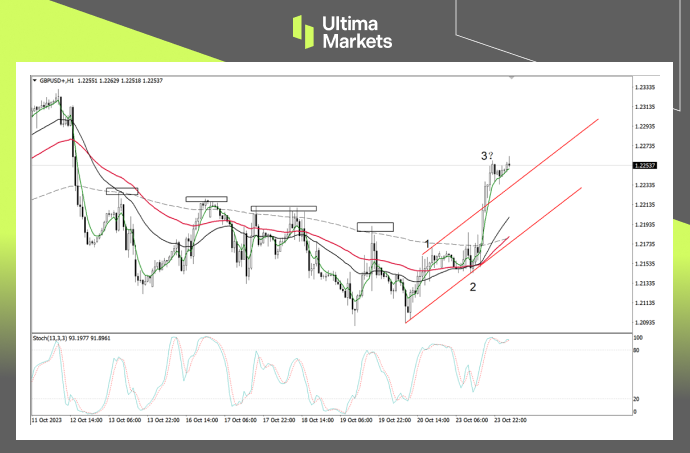
EUR/USD 1-hour Chart Analysis
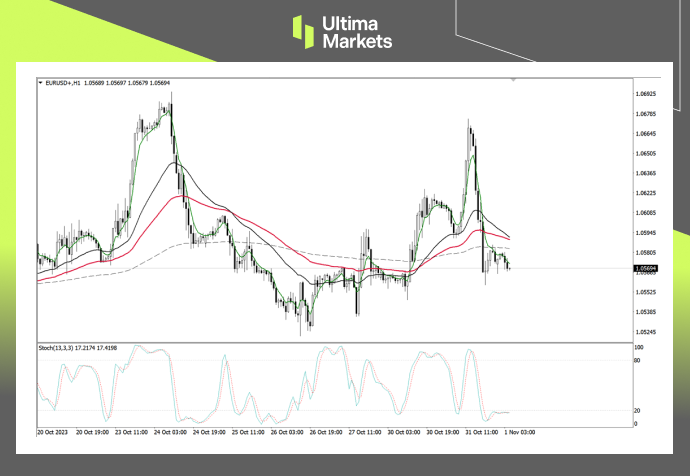
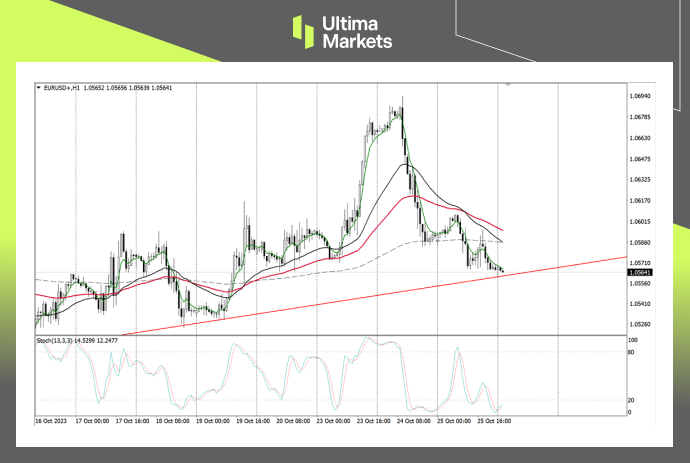
- Stochastic Oscillator: The fast line is about to cross the slow line, suggesting that the exchange rate is about to fall into consolidation in the short term.
- Moving average combination: The exchange rate fell below the 200-period moving average. Currently, the 33-period moving average and the 65-period moving average have not yet crossed the 200-period moving average. Theoretically, when the fast line crosses the slow line, the market may return to the short-term moving average group.
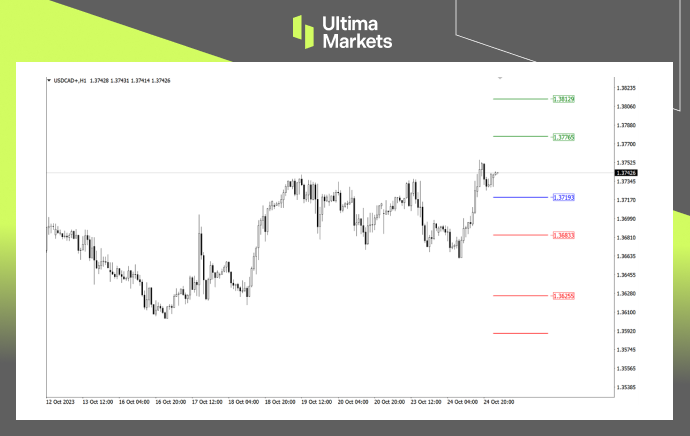
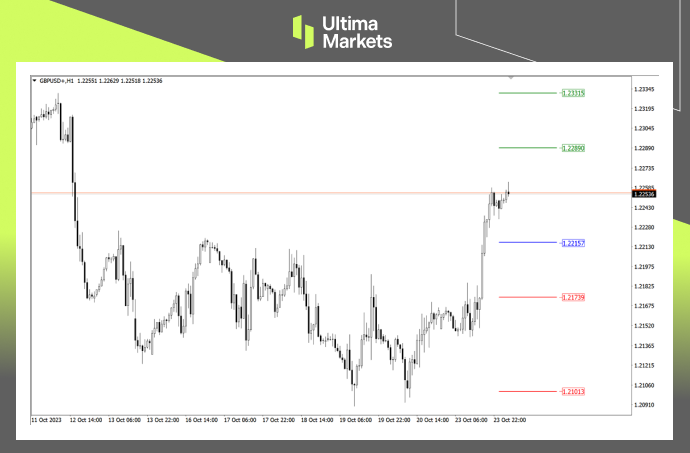
Ultima Markets MT4 Pivot Indicator
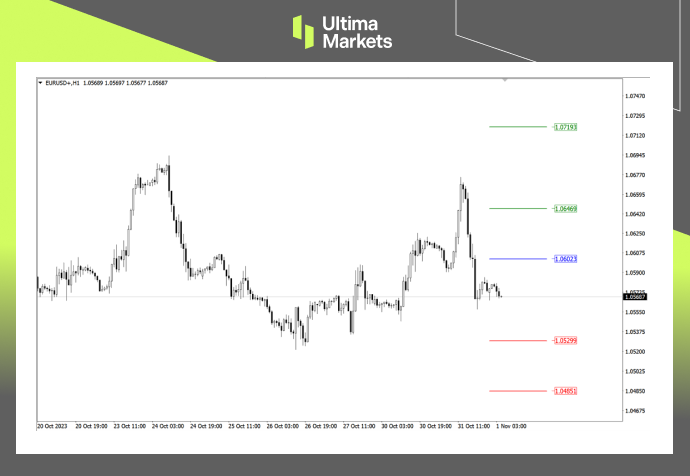
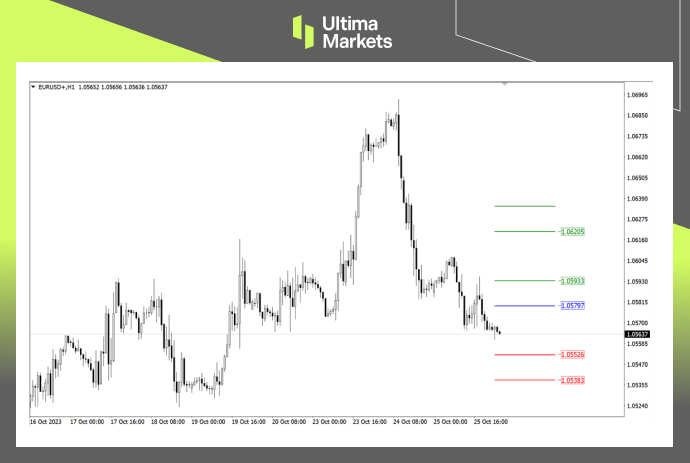
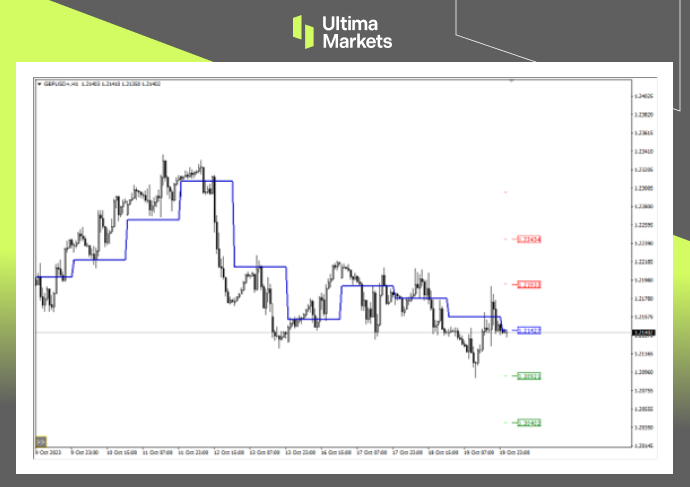
- According to the pivot indicator in Ultima Markets MT4, the central price of the day is established at 1.06023,
- Bullish Scenario: Bullish sentiment prevails above 1.06023, first target 1.06469, second target 1.07193;
- Bearish Outlook: In a bearish scenario below 1.06023, first target 1.05299, second target 1.04851.